You may wonder, what is a project network diagram? Project management is all about planning hot a path taking into consideration your budget, your resources, your objective and your team.
However, what about projects that are complex by nature and include many different and interdependent activities? Network diagram project management working help to calculate project duration and create a visual map of your project from start to finish for you. In this article, you will learn about the network diagrams, their use, their benefits and how you can use them through Sinnaps, the project management network diagram software.
Índice
What is a Network Diagram?
Network diagrams serve as visual representations of a project. Network diagrams are complemented by  PERT and Gantt charts. In terms of planning and tracking a project from beginning to end, network diagrams are invaluable in today’s world. Both the project’s critical path and scope are defined. An effective project schedule network diagram will serve as a clear and concise representation of the project.
The Arrow diagram and the Precedence diagram are the two types of network diagrams that exist. In an Arrow diagram, nodes are used to depict events and arrows are used for activities, whereas activities are depicted in the order they occur in a Precedence diagram.
In Arrow diagrams, each event node refers to the instant in which an activity is started or completed. An event node only occurs when all of the activities entering the node have been completed and the arrow represents the activity that is taking place during the event.
If we were to take an example of a task in a project being ‘research location possibilities’, then the event nodes would identify the beginning and end of this particular activity while the arrow would identify the activity itself.
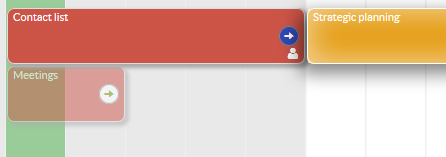
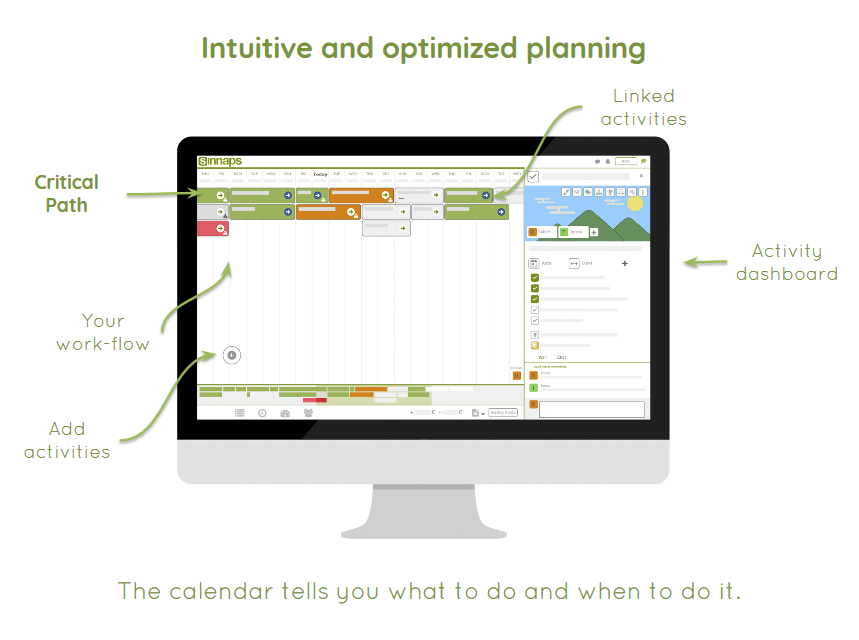
Network diagrams that use the arrow and node method allow you to depict clearly project dependencies. Through the use of a Gantt chart or an online project management software Sinnaps’ updated ‘Gantt-flow’, activity dependencies are clearly defined. Project managers and teams have a clear understanding of which activities or tasks must be completed in order to begin others and to therefor assign criticality to certain, more important tasks.
Besides, most project managers follow the four project life cycle stages and make decisions based majorly on the phase they’re in.
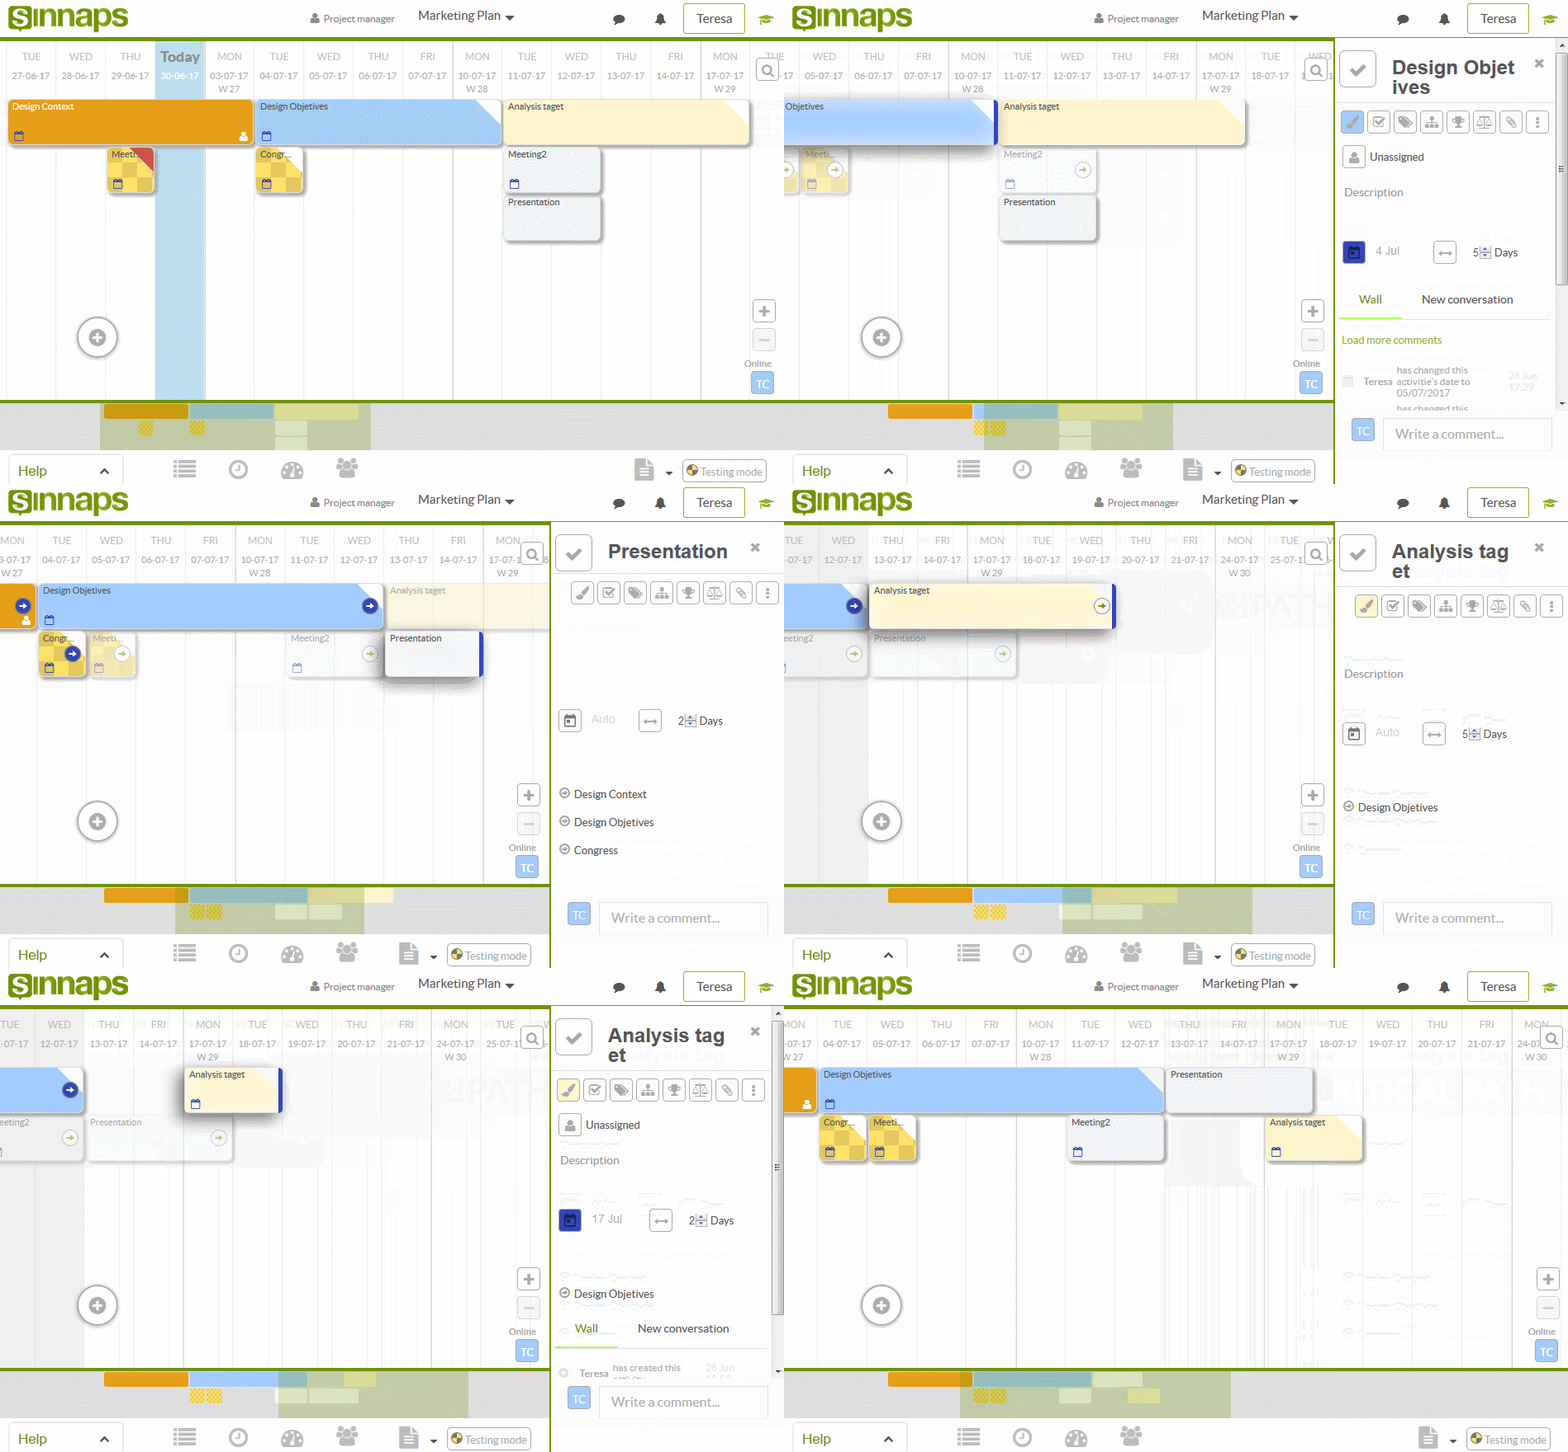
Network Diagram of Sinnaps

‘Dummy arrows’ are dotted lines with arrows that are sometimes included in network diagrams. They do not necessarily depict task dependencies, but rather their logical relationship. They hold no duration and don’t depict activities. They serve as a transfer of logic from one event node the next.
After mapping out a project, making a project plan diagram, a key can be written for the visual representation which will list the duration of events and activities. In the end, the project schedule network diagram will provide you and your project team with a clear and useful visual representation of your project process that will undoubtedly improve your projects.
What is a network diagram used for?
Since they portray how components interact, network diagram project management plans serve a multitude of purposes, some of which include:
- Planning the structure of a project
- Coordinating updates or changes automatically
- Identifying potential risks or bottlenecks of a project
- Documentation for external communication
- Keeping track of project progress
- Selling a project proposal to financial stakeholders
- When proposing changes to stakeholders
- Helping to justify the time estimate for your project
- Aid in planning, organising and controlling your project
- Identify activity interdependencies
- Define the project workflow
- Identify opportunities
- Show project progress with a Project Report
How to make realistic plans?
Online Project Management Course

What is an activity network diagram?
An activity network project diagram is a diagram visual representation of all the sequential and dependent activities within a project. The relationships between all the activities are represented by arrow and nodes. It is a toll used widely in project management due to its effectiveness in helping a project team in reaching its goal efficiently, working out project duration times and defining a project’s critical path.
An example of an activity network diagram is any project with several activities as part of its process. Suppose a team is tasked with renovating a kitchen, an activity network diagram or project management diagram would list and portray all activities from buying materials to completing the final clean.
A team and PM create an activity network diagram that aids them in planning and organising all the activities in a project. The nodes (boxes) represent the activities and the arrows that connect them represent the flow and what activity follows the next.

Some of the project process steps run in series, while others run in parallel. Series represents activities that are sequential, but face dependencies. This means that one after the next cannot be started until the one preceding has been completed. The activities running in parallel face potentially having different completion times because they are dependent on the series of activities preceding.
Critical Path
When creating a critical path of a project, that is, finding out which activities are most critical to the project’s process, you must take into consideration which nodes will take the most and least amount of time. The critical path goes through all the nodes with the longest expected completion times.
In Sinnaps, the critical path is made clearly visible to users as it is highlighted at the top of the network diagram. Any activities that are running in parallel with the critical path must consider how long their completion will take and be on par with the critical path.

Most Likely Time
Most Likely time defines the expected completion time of the project. Usually, it is defined and based on the critical path.
Optimistic Time
If a project team wished to know the fastest time in which they could potentially complete the project, they must decide on the shortest possible time for each of the nodes. In this way, if they complete each node in its established shortest time, the project will be completed faster. This would be seen as the most optimistic outcome of the project.
Pessimistic Time
A project team may also wish to see what the worst-case scenario would be in terms of project duration. This is a useful feature of a network project diagram as it prepares both the project team and stakeholders for the worst. The team would have to decide on the longest possible amount of time that each node could take. After adding these values, the longest duration a project could take is produced and is seen as the most pessimistic outcome.
Expected Time
Overall, expected time portrays what a project’s most likely duration would be, but also warns of potential longer durations or the possibility of a faster completion date.
Benefits of network diagram in Project Management?

Network diagrams are useful in project management in many ways. Some of the benefits of using network diagrams include:
Network Diagrams help validate the time estimation for your project: Networkdiagrams paint a clear picture of how varying tasks fit in to a project and their specific interdependencies. This allows for useful duration estimation. Through the development of a critical path and the activities that lie on it, a rather accurate project duration is produced and can be used to communicate to stakeholders.
Network Diagrams aid in planning, organizing and controlling: Due to the sequential visualisation of all project tasks and activities and all their dependencies, planning the project is an easier feat whilst being able to take into consideration the criticality of each task. The snapshot of activities aids in how a PM organises the project. Cloud-based project management apps such as Sinnaps further aid in this area with a feature called Test-mode which allows PMs to produce various network diagrams before choosing the one that suits best.
Task interdependencies are clearly defined: With the help of visual representation of project tasks, their dependencies, criticality and duration are all clearly defined. This allows for a more effective project workflow as team members receive a more in-depth understanding of the individual tasks and how to perform each one in order to reach the project’s objective and goal.
Activity workflow is defined: A project’s workflow is important to have planned and understood. What activities are dependent on each other and what their sequence is is all represented by network diagrams. Network diagrams such as those created on Sinnaps show which activities in the workflow have been completed and when, which are in process and which are left to be done. A PM in this way, can judge the effectiveness and status of a project’s workflow.
Network diagrams identify opportunities to compress the schedule: Some activities or the project in general may need to be shortened in duration. This may need to be done for a number of reasons. Since a network diagrams lays out everything clearly, it is easier to see which activities, depending on their criticality, can be shortened or even omitted.
Project progress is constantly identified: Since a network diagram visual represents everything to do with a project, progress it visible clearly and PMs can judge how could or bad they and their team are performing.
Overall, network diagrams help a great deal with time management of projects. Whether it is knowing specific task durations, seeing and understanding ask interdependencies and how they affect the project as a whole or having the project’s workflow defined, network diagrams are invaluable. A project team is more likely to identify potential opportunities within the project since a network diagrams serves as a visual representation of the project which helps to paint a clearer picture and give a more in-depth understanding of the project.
How to draw project network diagram layouts with Sinnaps
If you are wondering about how to draw a project network diagram in project management apps, look no further! Network diagrams are immensely useful in today’s world of often complex project management. Now that you understand more about what they are you need to know what platform to use them on. Sinnaps presents you with the option of creating a clear, effective and concise Gantt-flow’. Creating your project’s Gantt-flow could not be easier and more effective.
Using your free trial, you can see for yourself! Create your Gantt-flow network diagram and see clearly your project’s critical path, optimised workflow and all task dependencies portrayed to you visibly.
Using CPM and PERT methods, Sinnaps, the project management network diagram software, has created a user-friendly, interactive, cloud-based and modern platform for effective and efficient project management. Whether you are a project team member or project manager, now that you understand more about how to construct a network diagram in project management, try it out and see for yourself! Get started now

Being able tounderstand how to make a network diagram is a useful skill, and a collaboration diagram example with explanation can helpful for learning how to do this.
Projects can be complex by nature and their planning can seem even more complex, especially when there are many activities and interrelations involved. When looking at a Gantt-char or Sinnaps Gantt-flow, it may be difficult to understand how the project’s duration and critical path has been calculated at first glance, but after reading this article, we hope you now see how Sinnaps does what it does for you and your projects! 😊
Leave a comment below sharing your opinion of network diagrams and their use in your past experiences or ask us a question and we’ll be sure to get back to you!

