Online Gantt chart maker is the best tool to organize your work and your team. In this article, the history of the Gantt chart, what it is used for and how it can help improve the running of your business, its variations and Sinnaps’s specific Gantt-flow will all be described. How to create a Gantt chart online with Sinnaps will also be described. You will learn that with Sinnaps, creating and using a Gantt chart comes with various advantages.
It is fair to say that today, as was the case many years ago, improving and optimising the process of planning business projects is imperative to all companies. Projects and their planning is something that cannot be avoided. It can be difficult to manage the different activities of a certain project, allocating different resources and then keeping track of everything.
Índice
History of the Gantt Chart
Back in the 1890’s, a Polish engineer named Karol Adamiecki devised what was then the first version of what today is known as the ‘Gantt Chart’. This chart was created in order to improve and facilitate the management of the steelworks that Adamiecki ran.
Some 15 years later in the 1910s, Henry Gantt, an American engineer and project consultant developed his own version of the chart. It gained widespread popularity in Western countries and subsequently, the name associated with these charts was Gantt’s. Today, it is the most widely used chart in project management online and is given great credit among all sectors of business.
As old as the first Gantt chart may be, its constant renovation and improvement with the help of modern software means that it stays relevant and very central to project management today. It is still recognised as an essential tool for clear and effective planning.
Back in the 1910’s each chart was prepared painstakingly by hand and it was necessary to begin anew each chart every time a certain change or addition was made. This limited their usefulness to some extent due to the simple fact that constant change is a popular feature of most projects.
All about Project Management Chart
- Online FlowChart Maker: How to Create it?
- Online Timeline Maker
- Project Gantt Chart:How to complete your plan on time?
- Gantt Chart Software for Project Management
- Project Management Chart: A tool to Achieve your Desired Project Outcome
- RACI Chart
What use has a Gantt Chart in Project Management?
In today’s technologically advanced and ever-advancing world, it is much easier to create and apply the charts effectively to businesses. Today we can use them to track project schedules using planner Gantt chart available to us allowing for easy creation, modification and dispersion of the charts. They are extremely useful to businesses for several reasons. Generally, they allow us to:
- See what the various activities of a project are
- The beginning and end of each task or activity
- The scheduled duration of each task
- Where certain activities overlap and by how much
- When the whole project should begin and end
A Gantt chart aids project management in scheduling, managing, and monitoring specific tasks and resources of a project. The chart displays the timeline of the project that includes scheduled and completed work over a period. The chart helps project managers in communicating its status or plans and helps to ensure the project remains on track and that everyone involved is notified on the current situation helping to avoid uncertainty.
Furthermore, the chart allows managers or team leaders to see what tasks can be performed alongside each other and others which cannot be started or finished until certain other tasks are completed. The detection of potential bottlenecks is aided as is the identification of tasks that may have been excluded from the timeline.
Any slack time or additional time needed for the completion of a task that should not delay the project is showed on the chart as are the non- critical activities that can be delayed and the critical tasks that must be completed on time.
There are many different types of projects and many, most in fact, can be quite complex due to their interrelating activities and heightened degree of uncertainty. Within a project, there exist many different activities and tasks, some of which depend on the completion of other tasks before they can be started themselves.
Additionally, resources must be allocated in a project to certain tasks and people. Gantt charts allow you to include this decision and allocate within the cart the said resources. However, it can be a complicated task.
In a general sense, a Gantt chart puts clearly into perspective what must be done and when in order to successfully complete a project.
Who are Gantt Charts useful for?
Gantt Charts are useful for team leaders, project and business managers and team members themselves. They allow for clarity, organisation and effective planning and tracking of tasks and activities in order to successfully complete a project.
There are several types of Gantt Charts, the most common being the Load chart and the Schedule chart. The Gantt Load chart is used to effectively depict the loading and idle times of a group of machines or a list of departments. However, it does not account for production availability such as unexpected breakdowns or human error that usually requires a job to be re-done.
A Gantt Schedule chart essentially schedules a project. It puts into perspective the estimated duration of a project and its various tasks and the actual progress of each of these tasks.
When Gantt Charts were first created, it was a laborious task to set them up and then to modify them along with any changes, which can be continuous. Then came the era of Microsoft project, an easier way to create and modify the charts. Currently, a wide array of software is available that has wholly improved the process of creating and using a Gantt chart. Sinnaps presents itself as one of those options.
Many professionals work daily with Sinnaps in order to improve their project planning and execution effectiveness. At Sinnaps, we have created a slight variation of the classic Gantt chart which we call the Gantt-flow. True to its name, it allows for planning to be flexible and includes real-time communication to ensure that decisions can be made efficiently and effectively.
Applications like Sinnaps allow for the creation of these charts online in a simple and effective form through the use of a simple Gantt chart template. The activities or tasks which comprise a certain project are planned for a specific date, taking into consideration other tasks that must be completed. In other words, sometimes, before beginning a new task, you must have completed another previous task.
Project planning can be thought of as a path to a certain destination, which would be the completion of said project. In general, many different paths can be taken to reach the same end point. The Gantt-flow optimises this path and demonstrates clearly the best one to follow to reach your destination.
Effectively, the Gantt chart helps to form the project into a path and presents the various tasks and activities as certain steps along the path. Sinnaps helps to position these steps on the most suitable and correct date so as to optimise time and help to effectively complete the project.
Thanks to the techniques based on PERT (Program evaluation and review technique) and CPM (Critical Path Method) technologies used by Sinnaps, the dependencies of certain tasks are considered and automatically generate an optimum workflow per the specifics of each project, of course.
PERT AND CPM: Some of the best Gantt Chart software
The Program Evaluation and Review Technique (PERT) is a method used for planning and coordinating significant projects. “PERT is basically a management planning and control tool. It can be considered as a road map for a particular program or project in which all of the major elements (events) have been completely identified, together with their corresponding interrelations’, PERT charts are often constructed from back to front because, for many projects, the end date is fixed and the contractor has front-end flexibility”, as explained by Harold Kerzner. Critical activities on which other activities depend are identified by the technique. It is a technique often referred to as CPM which stands for ‘critical path method’.
The technique was established during the 1950s through the efforts of the U.S. Navy and some of its contractors working on the Polaris missile project. Anxious about the growing nuclear arsenal of the Soviet Union, the U.S. government wanted to finish the Polaris project as quickly as possible. The Navy used PERT to organize the efforts of around 3,000 contractors involved with the project. Experts attributed PERT with shortening the project duration by two years. Since then, it is a requirement that all government contractors use PERT or a similar project analysis technique for any major government contract.
Difference between creating Gantt charts online in general and Gantt charts online with Sinnaps.
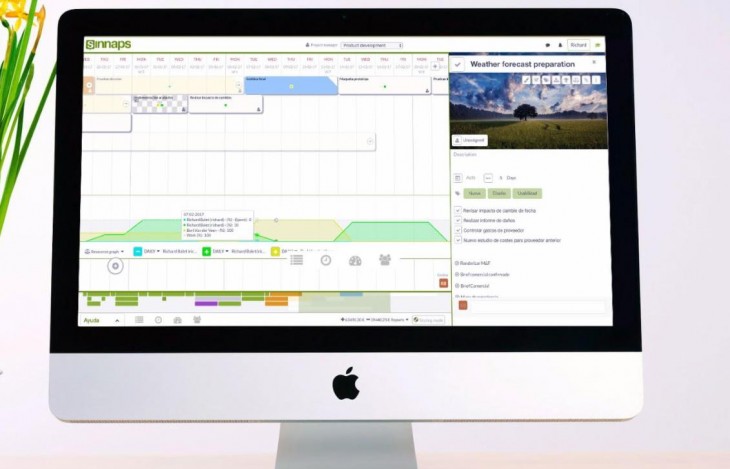
Here is what it looks like to create a Gantt chart online with Sinnaps.

How to make a Gantt chart online?
A Gantt-flow created using Sinnaps is an example of Gantt chart for project management and allows for the use of a simple Gantt chart template. Firstly, tasks are ordered along a timeline and taking into consideration their specific dependencies. An optimised work path is, thus, generated and read from left to right, top to bottom, just like a book. Sinnaps then helps you to prioritise each task according to the weight you initially gave to each one.
CPM allows us to see what we call the critical path of a project that must be followed and appears as the first line of activities. All prioritised activities must be completed on time. This allows for the project to be completed in minimum time. As they say, ‘time is money’ and saving a little extra when possible never does any harm.
Sinnaps is a Gantt chart online generator and is differentiated by this feature as there is no other online program that allows for easy and flexible decision making by eliminating activities, prioritising tasks or adding or taking away resources. The process is more laborious and complicated in comparison to Sinnaps facilitative feature which takes into consideration one of the most important and unavoidable aspects of project management: continual change.
Something very useful and time-saving that the Sinnaps Gantt chart creator includes are last-minute changes. There is no need to manually go back and change each activity just because you need to include a new one. Instead, it is fitted in and optimised along with the other tasks automatically.
A traditional and classic Gantt Chart was untouchable and unmodifiable unless you were prepared to re-do the whole thing from scratch. Thankfully today, this is not the case. With Sinnaps online Gantt charts, you can change anything whenever you need. Everything will be updated automatically along with the introduced change while also notifying other team members.
The advantages of creating a Gantt chart online using Sinnaps include:
- Easy and intuitive planning
- Project can be complex or simple
- Easy and direct communication
- Flexible planning
- Quick response to setbacks
- Supports the process of making fast and effective decisions
- Optimisation of your work path
Here are two examples of classic Gantt charts:


![]()
In the two firsts examples, you can see how activities and tasks are loaded on top of one another creating a complicated graph, difficult to read and with no real optimisation. This is even worse for complex projects that include many tasks, so much so that people are required to do extensive training courses to learn how to use the ‘useful’ tool.
According to the timeline, tasks are read from left to right, but in order to see what corresponds with what you need to go to a separate list of activities. This adds unnecessary difficulty and complication to the process which Sinnaps helps to avoid.
One of the biggest setbacks in project management and planning is the uncertainty faced by team members in terms of identifying exactly what their job is among all the other team members. Sinnaps also helps to solve this aspect through outstanding workflows. Doubt is evaded thanks to certain filters that highlight your specific work path.
It is quite interesting how people who have tried and experienced creating a Gantt chart or ‘Gantt-flow’ as we like to call it, online with Sinnaps find it difficult to go back to using a classic Gantt chart. Work evolves and changes in the same way as does its planning and organisation, something that Sinnaps truly understands.
At Sinnaps we believe in simplifying and therefore shortening the time allocated to planning so that businesses can spend more time on the more vital aspects such as innovating and improving their product and/or service.
Gantt charts have gone through their fair share of evolution and improvement and are now moving towards being an easy to use, intuitive graph for all types of projects. This is exactly the variation to which Sinnaps is paying attention and helping us to achieve. Don’t unnecessarily waste any more time planning or trying to figure out how to create a chart, try Sinnaps’s easy-to-use Gantt-flow and complete your projects efficiently and effectively!
Related link…
Gantt Chart Example: collaborative and easy to use
The integration of WBS Gantt chart into your project will assist in creating a bar chart that tracks tasks across time; it will visually display the start and finish date of each task and the relationship between the tasks of the project thereby ensuring thorough project management.

