Gantt Charts are named after their inventor Henry Gantt who originally designed bar charts to manage and illustrate project schedules. Gantt Charts have moved on and been adapted to be more modern.
They’re so useful that they’ve become a staple of professional project management and business strategies for growth and delivery.
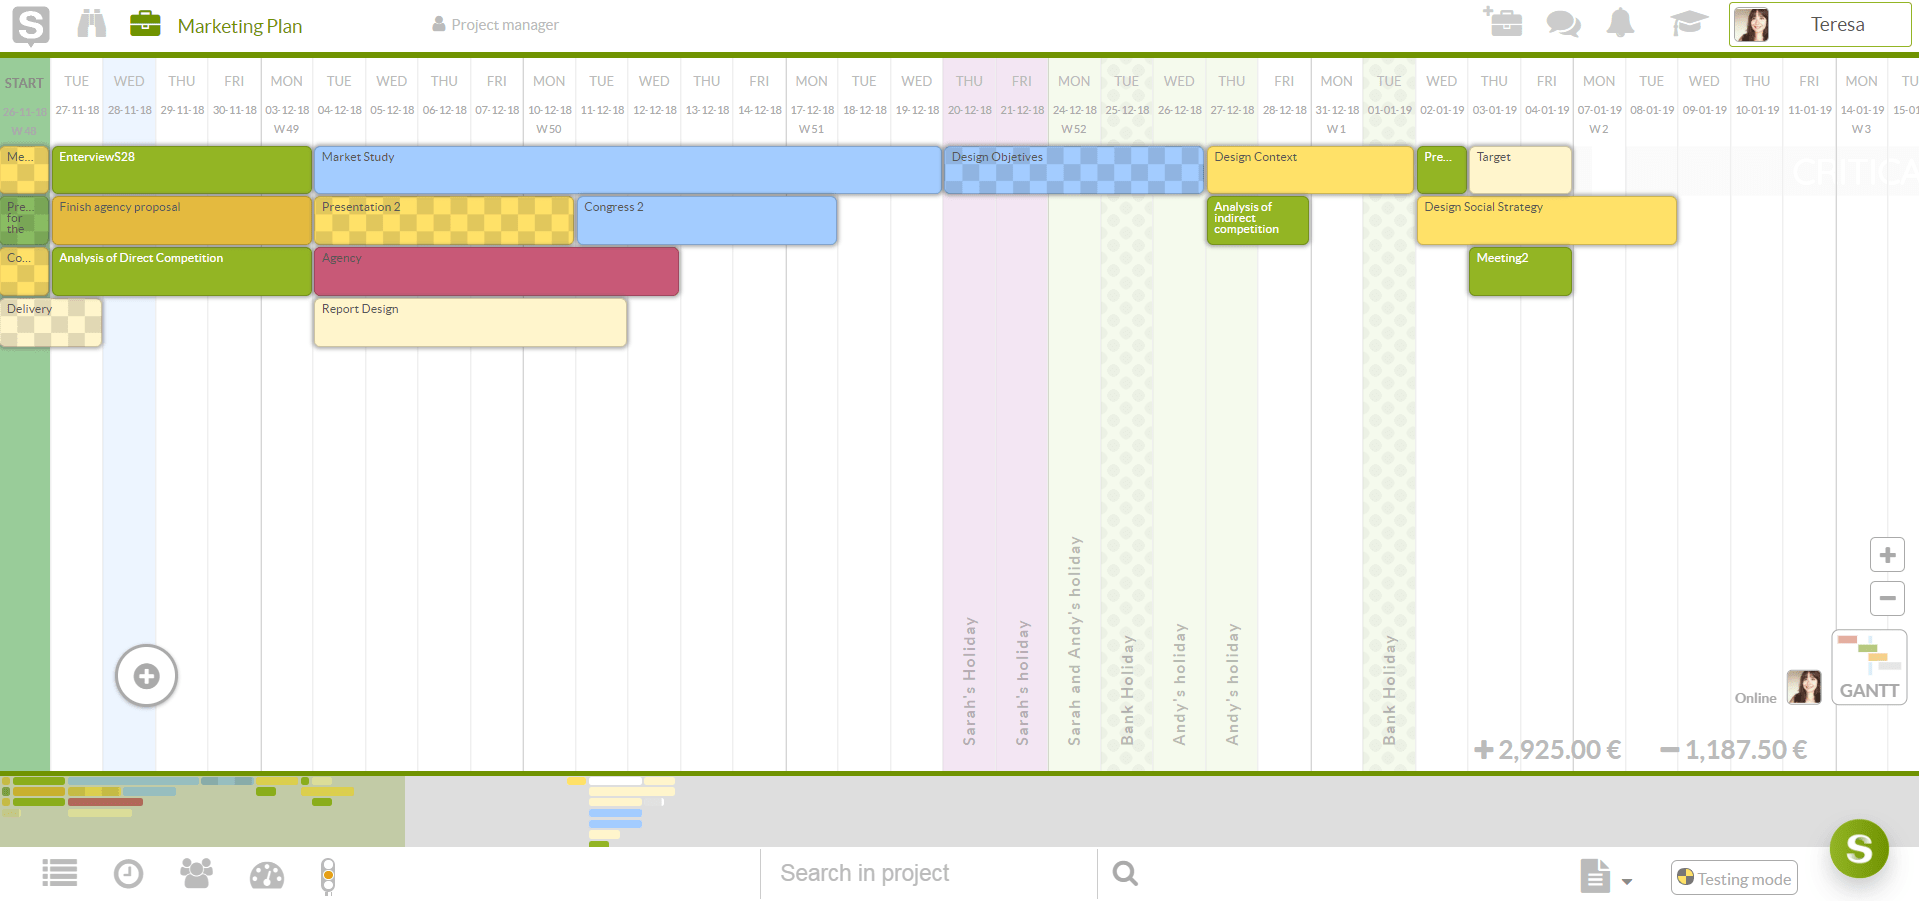
This Online Gantt Chart Example has the ability to display the dependency of the relationships between activities and a current project’s schedule status. It also provides powerful analytics through data visualisation and in-depth metrics that form the basis for the successful delivery of project milestones and KPI’s.

Índice
Gantt Chart Example
There are several types of Gantt chart that can be utilized dependant on the focus and desired outcomes of a particular business unit or specific task. Some project plan examples of the Sinnaps planner Gantt chart include:
- Event Gantt charts
For big corporate events, Gantt charts represent the list of tasks and the dates that correspond to those tasks.
- Weekly Gantt charts
This type of chart allows you to visually monitor resources, scheduling and dependencies to see weekly progress and stay ahead of upcoming challenges.
- Tracking Gantt charts
Using online Gantt charts for the management of services associated with a project’s requirements and their delivery.
- Marketing Gantt charts
This type of chart is perfect for managing social media and other marketing campaigns. It breaks down the tasks into manageable sizes and ensures the dependencies are fully accounted for.
Gantt Chart Example

Related links…
Function of Project Management
The integration of WBS Gantt chart into your project will assist in creating a bar chart that tracks tasks across time; it will visually display the start and finish date of each task and the relationship between the tasks of the project thereby ensuring thorough project management.
Gantt Diagrams Online
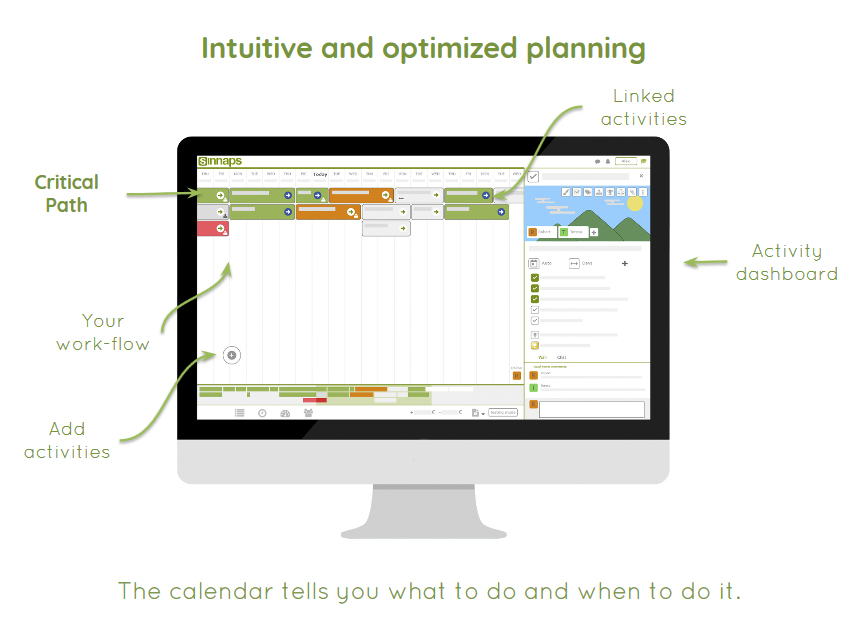
The newer version of Classic Gantt Chart is much better because calculates the best workflow. By calculating dependencies between activities, the Sinnaps Gantt charts automatically prioritise actions so workflows are properly optimised.
Sharing your Gantt diagram online allows for easy communication between teams and departments. Each employee can immediately recognise the areas of importance that relate to them and ensure that those assigned tasks are completed on schedule.
Being online means the Gantt chart is available to view from any location at any time. This gives team members the confidence to know they’re working within the correct parameters of a project related to their roles.
Gantt Chart Example with dependencies between activities

How to make a Gantt Chart
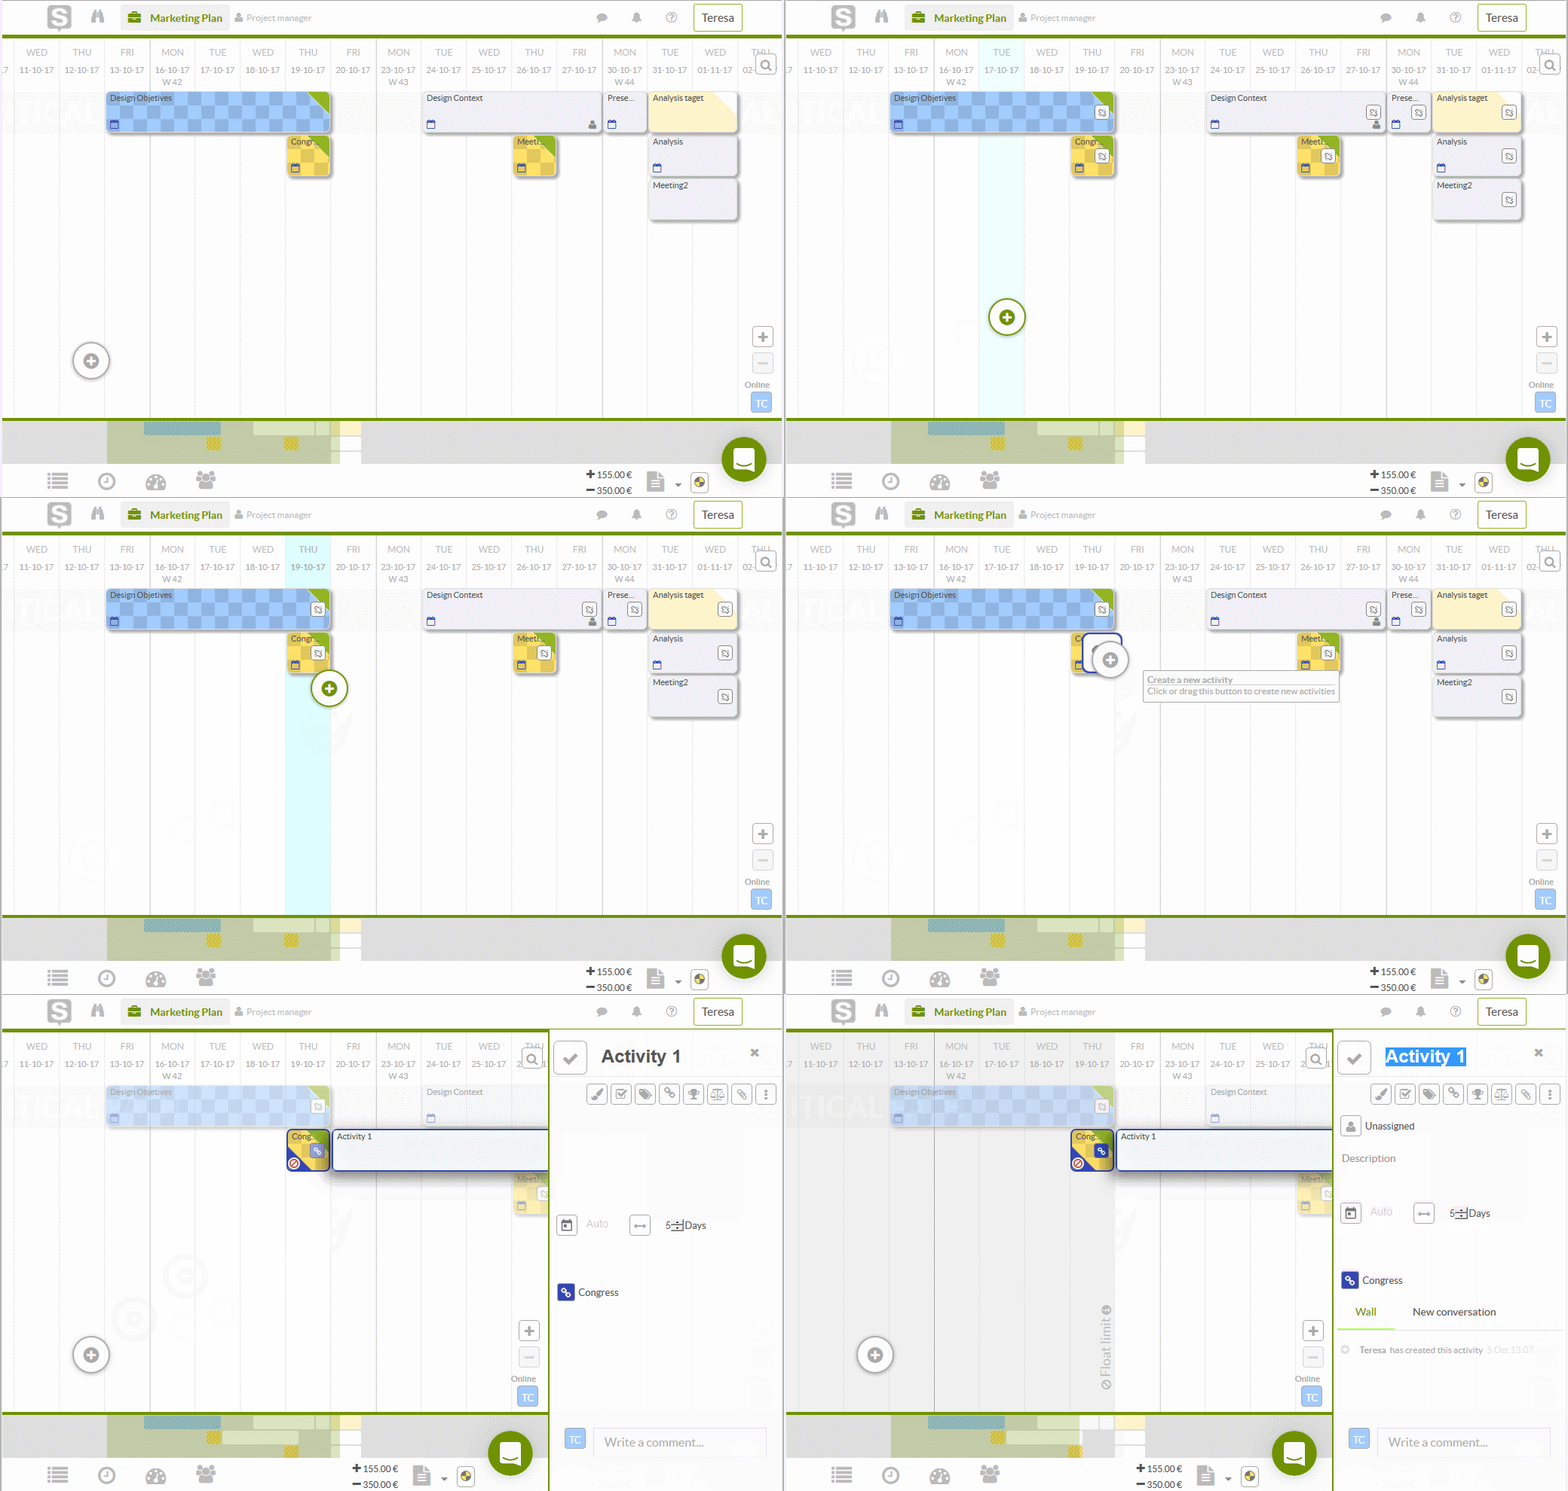
Sinnaps is simple and easy to use. It records the resources, tasks and timelines associated with the project cycle and project delivery. Using a combination of visual representation and online data workflows which are automatically calculated using project dependencies and goals to maximise workflow output. Gantt charts help your data make an impact on tasks, schedules, timelines, and workload efficiency. All you have to do is enter the information into the already designed Sinnaps Gantt chart maker to optimise workflow, dependencies and Gantt milestones.

Project Gantt Charts
Gantt chart planning takes the work out of managing complex tasks and optimises efficiency in planning and delivery. Through examples of Gantt charts for project management, we can see how successful they are and why they should be a part of any professional project managers toolbox. Project Gantt chart dependencies are the key to driving to successful outcomes and delivering the data and focused task instructions across the board. Overall project management is easy to digest and deliver when it’s displayed visually which is why project Gantt charts make is the perfect tool for professional project managers.
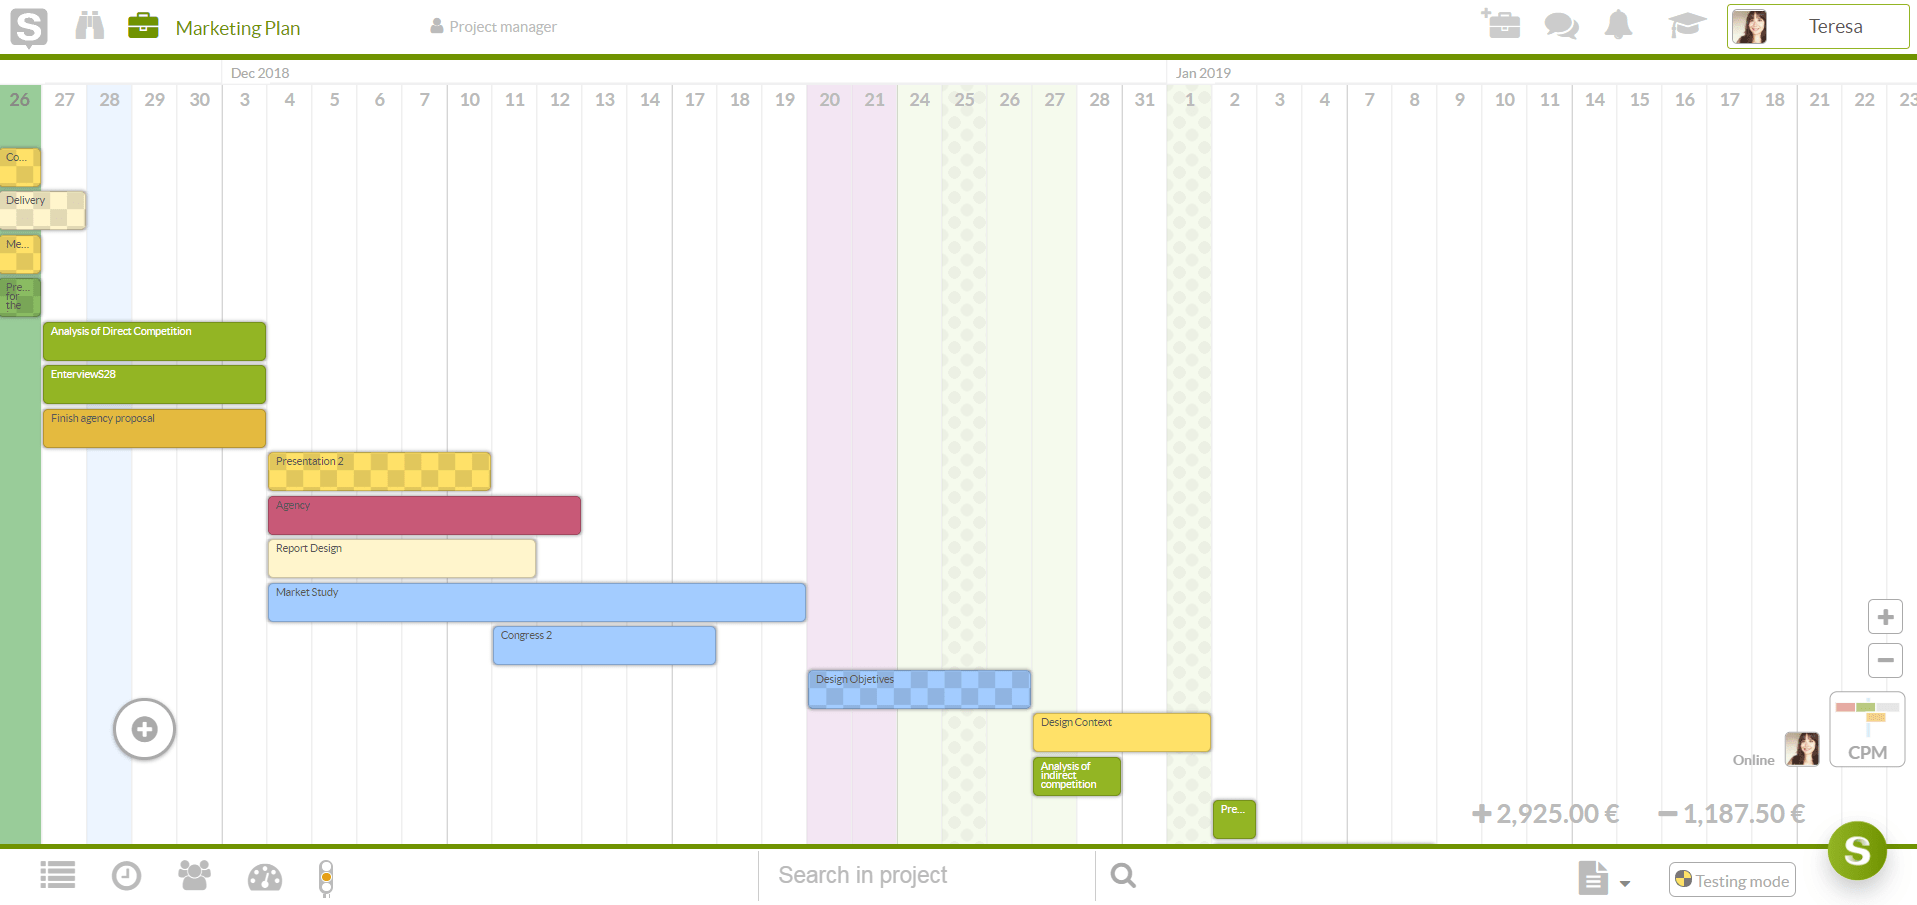
Classic Gantt Chart Example

Also, you can use an Excel however you must know that using Excel as Project Management is very time-consuming and it is also very prone to giving incorrect project information.
How to use a Gantt Chart
Sinnaps is able to map the best Gantt chart timelines and prioritise dependencies between activities, ensuring that the relationship between tasks is highlighted and they’re completed using the best critical path for live projects. Gantt timelines are designed specifically to illustrate the workflow of a project.
This provides a visual representation of the project’s tasks making monitoring simpler and therefore making it easier to identify if those tasks are running ahead or behind schedule. This ensures that deadlines are controlled, and stakeholder and team expectations can be competently managed.
Using Gantt charts allows you to manage specific Gantt chart milestones and utilise the Gantt timeline so you can stay ahead of bottlenecks and organise complex workloads.
Visualisation and illustration of tasks are shown to increase productivity and the achievement of specific goals. People absorb information much faster when it’s delivered as a graphic representation. As projects, progress and colours change or tasks can be seen to be achieved, it also instills a feeling of accomplishment. Immediately being able to identify a clash of resources or timeline issues allows for data backed competency-based decision making to occur. This makes Gantt charts an ideal solution for monitoring and delivering complex tasks with related dependencies.

