Índice
Project Dashboard
Project Dashboards are data dashboards that display key performance indicators (KPI) for effective project planning. Project management dashboards can also display milestones, report generators, and can also contain Gantt Charts. The best type of way to use them, would be to make a simple and easy dashboard in order to avoid as much confusion as possible for all parties. In general, they act as a data visualisation tool that helps to understand what the current state of the project is.

Dashboards are made up of components, these help to give it structure and clear readability. These components are:
- Charts – Visual representation of data
- Tables – Contains values and totals
- Metrics (Will be covered later on the in the article)
- Gauges – Shows the grand total of a report as a point of “fuel-tank”
There are multiple types of dashboard that you can use depending on your situation, these include:
- Task Management Dashboard
- Risk Management Dashboard
- Network Dashboard
- Small Business Dashboard
- Business Performance Dashboard
- Resource Management Dashboard
- Agile Dashboard
- Scorecard Dashboard
- PMO Dashboard
- Production Process Dashboard
- Project Portfolio Dashboard
Related links…
Best Data Dashboard
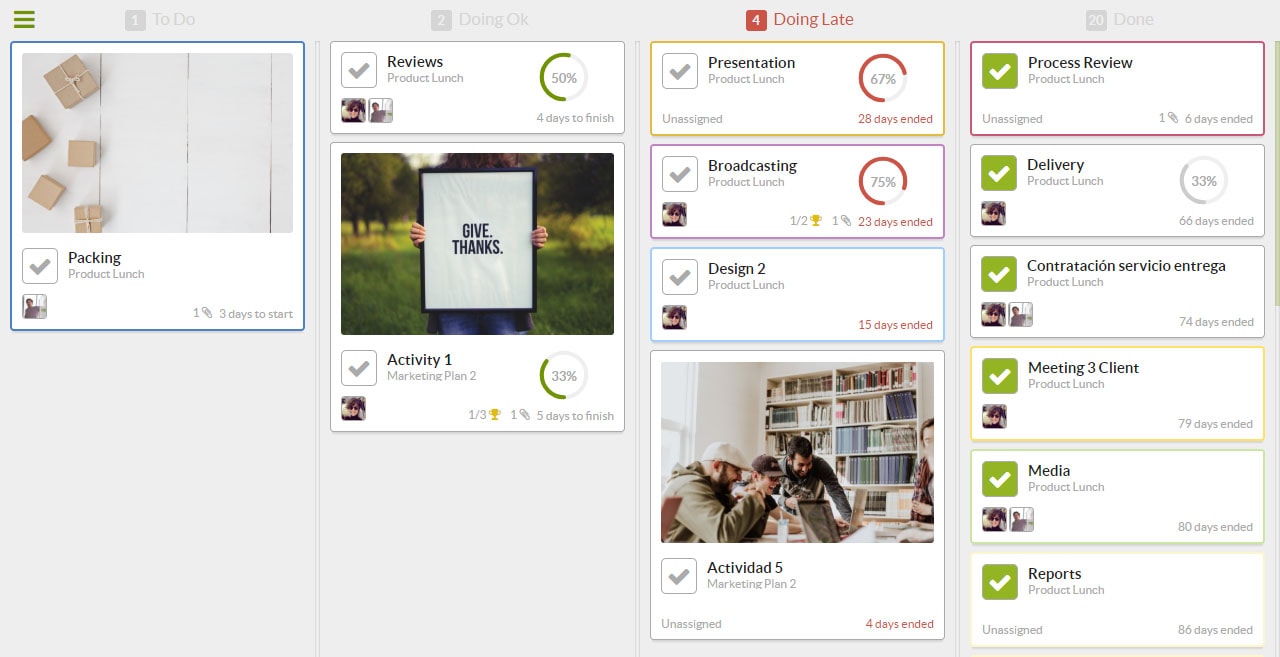
Two worthwhile candidates for data dashboards would be the Sinnaps Kanban and Trello Kanban. Kanban is a Japanese word that means “visual signal”, and is a useful way visualise the workload of your projects and therefore optimise workflow.
Trello Kanban is great for following the traditional use of a Kanban board, offering you effective task management. Trello provides unlimited Kanban boards and lists to track progress related to each activity in your project workload. The weakness of this tool is that it lacks a developed timeline view and the option to have project folders, this means that it may not be as streamlined or easy to use depending on what you’re going to be using it for. It also doesn’t manage resources but is great for task management.
Sinnaps project planning app on the other hand allows you to have multiple project plannings and easy Kanban boards for different projects by providing a list view of all the projects that you have been involved with. It’s also cloud based allowing you access your files wherever provided you have an internet connection, and works so that team members can be easily assigned to each task on the board visible to the project team. It also allows you to manage resources and it has a generous free plan.
Sinnaps Dashboard
Project Management Dashboard
A project management dashboard is usually a part of a software program – Excel for example, that enables easy access to the most important and critical information that relates to the project in question. This allows all parties to quickly and easily understand the current state of the project, what has been done, and what needs to be done in order to complete it. In Excel, a real-time dashboard view and real-time dashboard charts are also available for viewing.
They are used as a tool for better managing projects; being able to summarise and manage important information and present it in a clear format is an excellent way to help keep on track of project progress. Other benefits include better risk analysis and management, enabling managers to review information related to likelihood, outcomes, risk relevancy and more. In bigger projects, the benefit of this cannot be understated, as a significant amount of resources can be saved through using a project dashboard.
Project Performance Dashboard
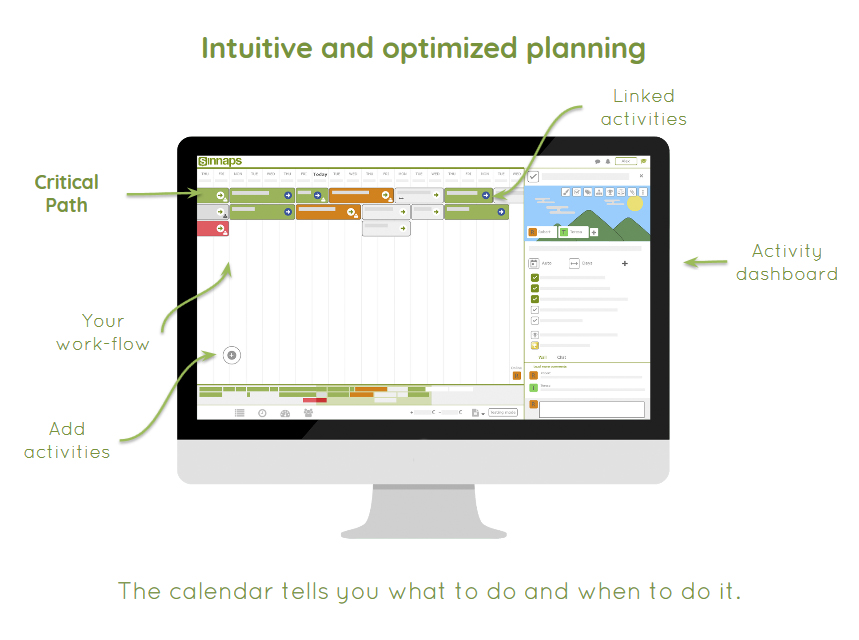
The performance of a project and everything pertaining to it is often important and crucial information that any project manager would need to keep on top of to be effective. The project dashboard helps to provide the information that comes under this category, displaying it in formats such as Gantt charts, which serves as a useful visualisation of the project’s current schedule.
Gantt charts can provide an effective means of displaying what needs to be accomplished and when. Critical charts are often provided within Gantt Charts, which are a display of all the tasks that are critical to the completion of the project, displaying which tasks are dependent on what.
Dashboard Indicators and Metrics
Dashboard Indicators and Metrics are the representations of the data that’s important for measuring the progress made by an organisation.
In further detail, KPIs are a metric used by organisations to track factors that are considered essential to the completion or success of the project and organisation. KPIs generally differ from organisation to organisation based on the factors that the organisation considers appropriate and important. A key performance indicator for a public company will often times be their stock price, while a start-up will consider their quarterly or yearly progress in terms of revenue, customers and so on as an important KPI. KPIs essentially, provide clarity in relative to how a business is currently performing.
Milestones are the main points during a project during which the significant tasks are completed, and are an important aspect of managing a project. Usually, milestones are integral to the project’s progression, and also help in breaking up the project into simpler segments.
Sinnaps Control Panel
To conclude, project dashboards are a great way to visually represent the data that’s important to your organisation’s metrics of performance and progress, allowing you to quickly and easily display the data that gives you a clear idea of where you and your organisation currently stand in terms of long-term or short-term goals and projects, alongside what currently needs to be completed to, or what has been completed or will be completed in the future.
Project Dashboards can be applied to just about any situation that requires a methodical and systematic approach, so consider applying any of your project dashboard ideas in order to make the best use of this tool.
