Gantt tables are used by business managers to quickly view critical activities bothering on their projects. Gantt chart tables are effective and can be applied to a myriad of activities including strategic processes for a new brand, product release, and can also be used in user-research surveys. Sinnaps Online Project Management software comes with a lot of features including free Gantt chart tables which lets managers build and visualize what tasks needs to be completed at a glance as well as monitor project progress in real time.
Often times, there is the need to prepare graphical illustrations of what tasks needs to be completed. With this, business leaders and project managers can go on to plan date-driven schedules and complete projects on time.
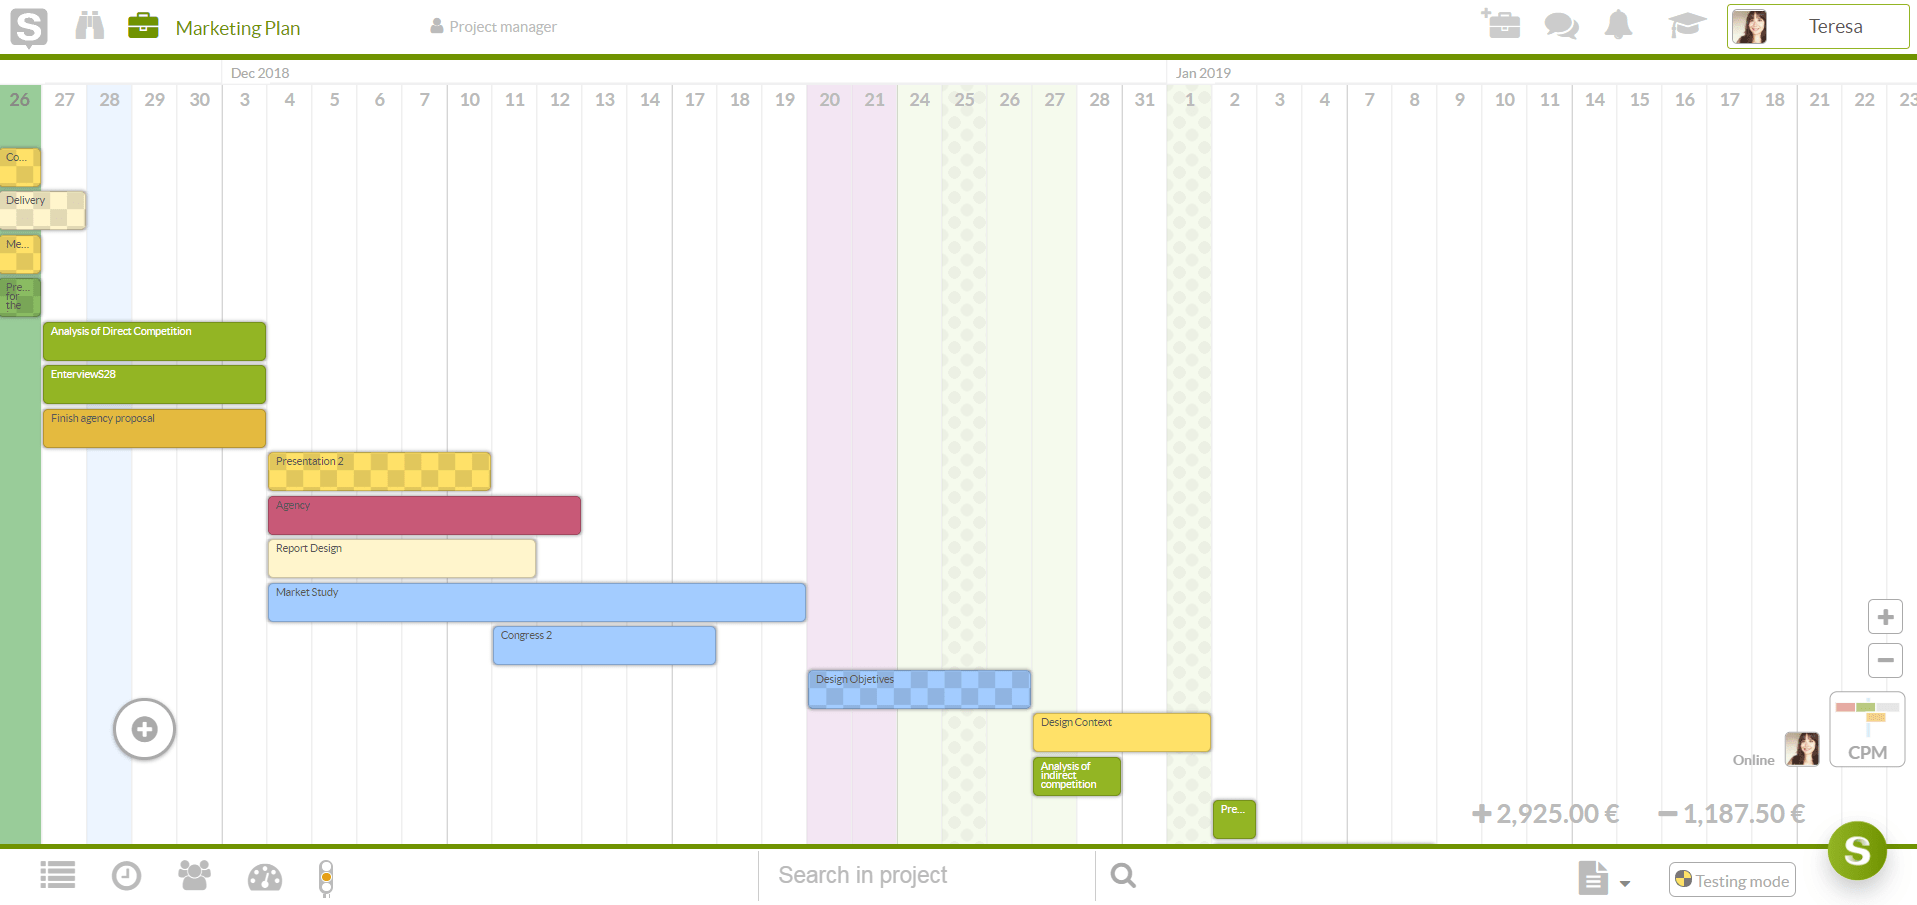
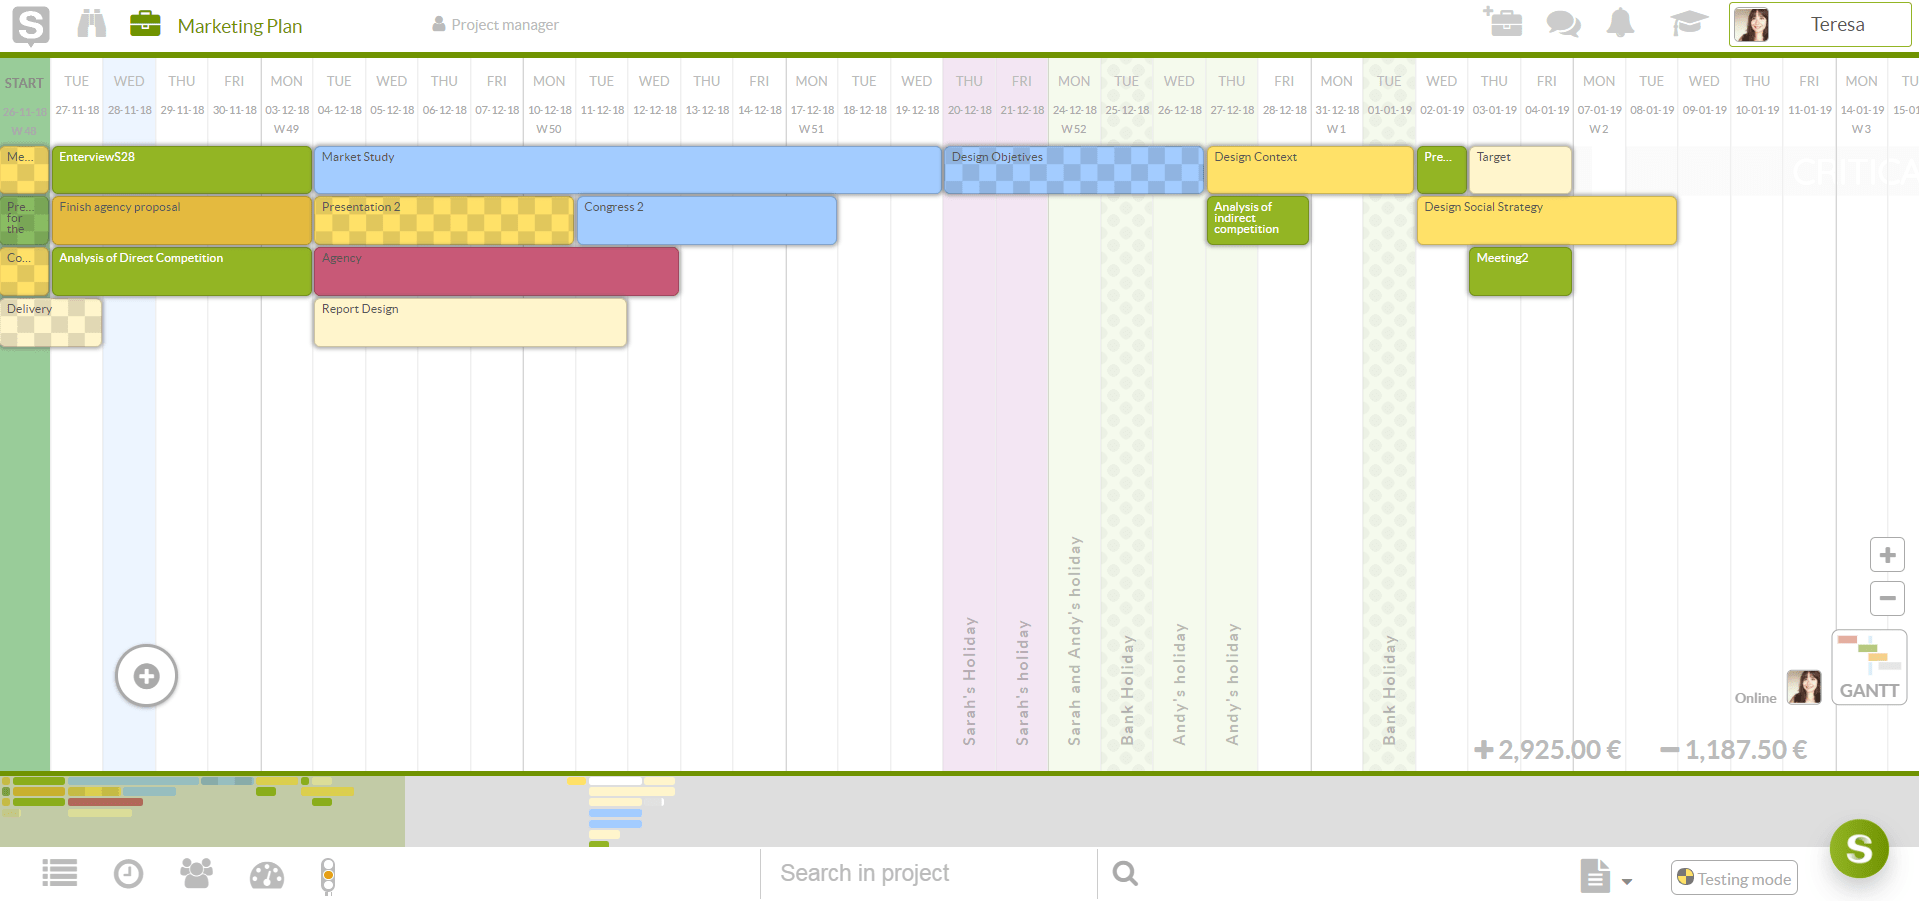
As an example, Gantt chart tables presents each activity as a bar, displayed against time and which provides a simple illustration of the tasks in view, duration, start as well as end dates.
Gantt chart are easily to prepare, and one may even decide to include additional information such as milestone, dependencies as well as project status. This will make it easier to schedule tasks in the order in which they need to be done, communicate the plan with team members as well as track project progress.
Related link…
Factors Affecting Productivity
How to make a Gantt Table in a few minutes
Gantt chart tables find applications in a wide range of activities. Therefore, it is necessary when making a decision as to which variety to use, that managers ponder over the information which they would want to include in the chart.
Below are some of the commonly included features of a Gantt chart table.
Classic Gantt Table:
- Dates
These are displayed mostly on the top of the Gantt chart, and are often displayed in quarters, months, weeks or days. Among other things, a predominant factor in choosing what timeframe to use in Gantt charts is usually determined by the timeframe of the project activities to be carried out.
- Tasks
Any activity or piece of work that must be done in order to complete a project are referred to as tasks. The start dates, end dates, and duration of each task is often represented by bars. You may decide to show what team member is responsible for each task, if it is in progress as well as percentage complete.
- Dependencies
In project management, certain tasks must be completed before another can begin. These tasks are termed dependencies, and in Gantt charts, they are represented in different forms, including by the use of small arrows between task bars.
Gantt Table with dependencies between activities. Here, activities are prioritized:
- Phase
It is a common practice in business, to group tasks by type. Take a manager who is working with a team towards the development of a new product. In such a scenario, the phases would include define, design, test, develop, and deploy. Project phases are often sequential and may even include overlapping activities.
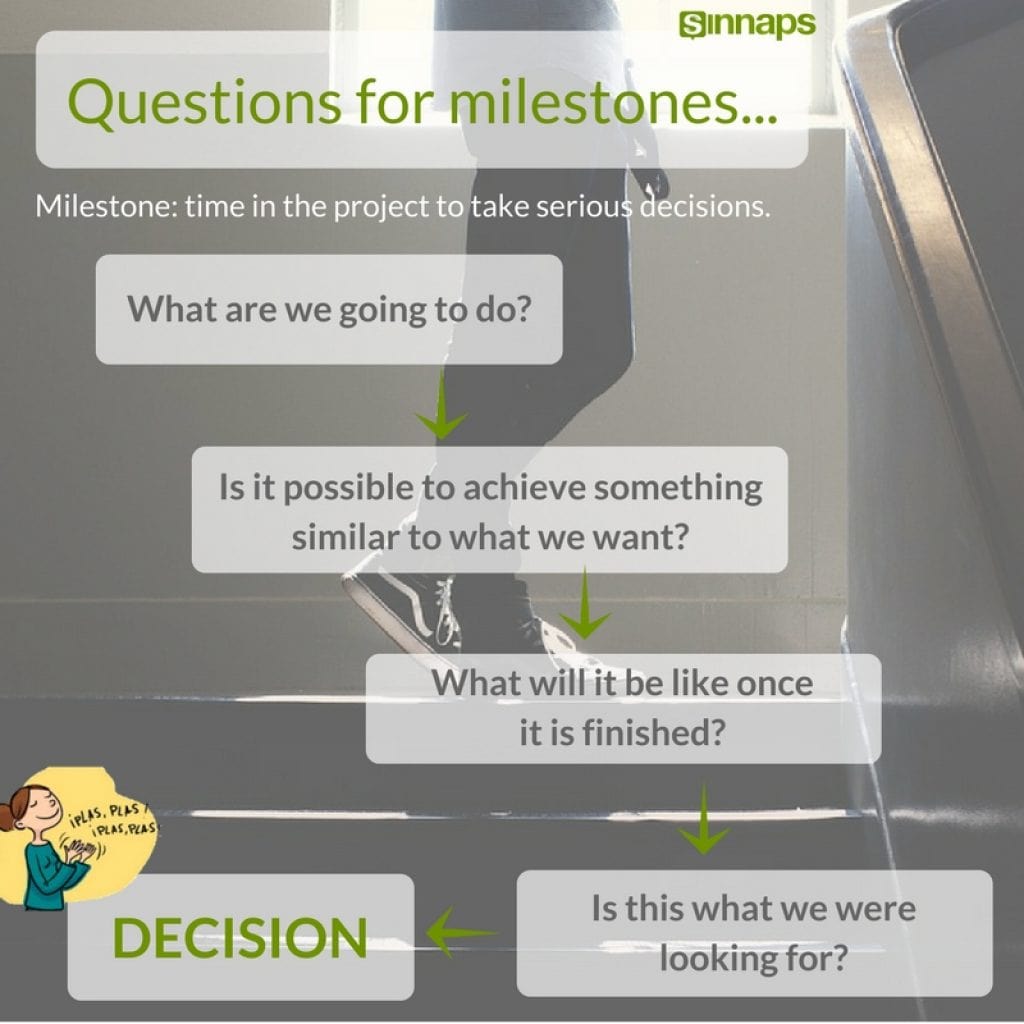
- Milestones
Milestones are often used to indicate significant points in a project schedule – these would include a collection of tasks that show certain aspects of your project that have been completed. Common examples of milestones include the start or end of a significant phase of activity, deadlines, as well as points in a project lifecycle that will see the making of an important decision.
Free online Project Management course
You will receive 5 lessons over the course of 15 days.
Lesson 4: The milestones, ‘to be or not to be’ and shall we continue with the project?
Editable Gantt Chart
To make it easier for businesses to manage a wide variety of tasks without expending energy and wasting precious time, various online collaboration software now provides editable Gantt charts to help managers define and implement their product strategies to reflect their planning horizon.
These editable Gantt charts find great use in business strategy, portfolio as well as product planning and task management. Editable Gantt charts make it easy to build comprehensive visual resources making use of information entered.
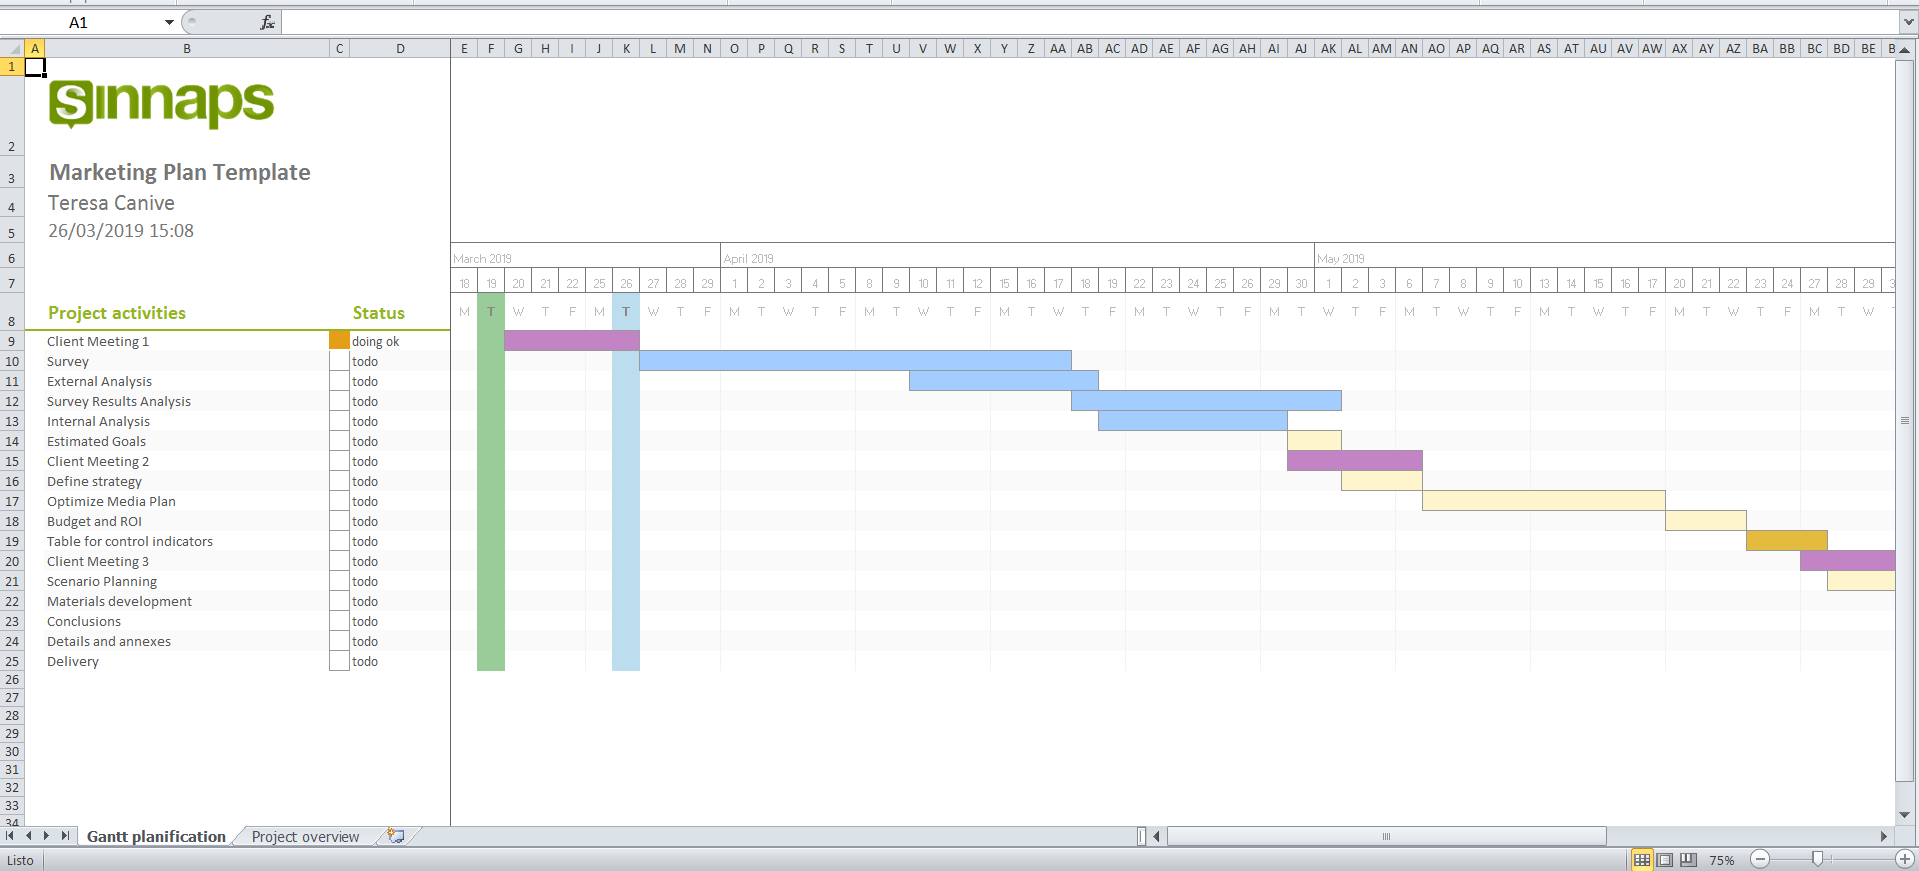
Download this Gantt Table in Excel
Behind the core principles of project management is a simple idea: Know what you want, determine how long it will take to do it, and take steps to achieve it. Although this idea seems a little simple, it becomes rather complicated when it comes to execution. Seasoned managers who have experience in project endeavours will tell how quickly things can get out of hand in the field.
The problem often begins when deadlines change, scope creeps, as well as a whole lot of possible complications set in. Therefore, to help project managers stay on top of tasks, Gantt charts was developed. It provides visual presentation of information to help managers quickly see at a glance – what needs to be done, see the start and end dates of each activity, monitor progress and identify areas where problems are likely to occur.
If you’re looking to make use of a collaborative workplace which lets you build a Gantt timetable in minutes, track progress, assign critical tasks as well as collaborate with remote team members in real time – then you would want to give Sinnaps a try.
