Project management is all about the effective planning of the activities of a project. The positive outcome of a project is anchored on how you can properly organize the tasks and resources. However, some project managers always get it wrong in their bid to plan the activities and resources of their project strategically thereby causing them to miss out on the desired milestone.
Hence project managers use Excel to create a timeline chart to ease their project management strides. A timeline chart in Excel keeps you up-to-date and informed about the tasks and resources of your project.
Again, a timeline chart in Excel creates the synergy among the project team by ensuring that they are on the same page as far as the project is concerned. A timeline chart in Excel will visually depict the chronological sequence of project events on a timescale. The timescale could be in days, weeks, months, or years.

In reality, Excel is never a project management tool unlike other tools like Sinnaps, an online project management tool with different in-built tools that can be downloaded easily to create the timeline chart of your project to ensure effective management.
In this article, we will discuss the merits and demerits of using Excel for project management and how you can create a timeline in Sinnaps.
Índice
Project Timeline Excel
No doubt, having a project management timeline helps you to pay attention to every detail as it allows you not to miss out on anything vital in the project.
A project timeline is the list of tasks arranged in an order to be accomplished to complete the project within the specified period. A project timeline Excel aids the project team in knowing the start date, duration, and End date of the project. This aids the team in tracking the status of the project to ensure that it is completed within the specified time.
No doubt, the use of the project timeline Excel assists you in maximizing your project plans and you are required to thoroughly plan and determine the flow of tasks from the start to the end of the project. A project plan timeline Excel is all you need to arrange your project plan in the right sequence. It can be edited with ease where there is a need for you to do so.
Furthermore, by drawing up your project activities in a project timeline Excel, you are offered a graphical representation that helps the decision-making efforts of the project team.
Also, it promotes effective communication among the team members because each one of them knows his or her role thereby boosting the success of the project.
By having a dynamic timeline in Excel, you are allowed to scroll the timeline through the database of events or project due dates.
Excel timing chart
An Excel timing chart is a tool that can be used to track the time of the workforce on an establishment. As a tool, the Excel timing chart will boost the time management in an organization because it can record the time in, time out and break time for every day of the week.
Also, the Excel timing chart comes with the ease of use feature as the total hours, regular hours, and overtime hours are calculated automatically on it thereby saving you a lot of time and stress.
An Excel timeline template is useful for project managers and their team members to have an idea of the stage of their project, the level of the work done, and how much work left to be done.
A timeline template Excel helps in keeping the project on track and will visually explain the milestones of the project. It can identify the potential delay and help in mitigating issues before they happen in a project.
An online timeline Maker is a project timeline software that is available for free and easy-to-use for business organizations. It is a web-based tool for creating the timeline of a project. It ensures collaboration among the project team because they will easily visualize their plans and update them.
A project dashboard template offers you a solution for monitoring, optimizing, and boosting the performance of a project. Also, it improves the productivity of the team because the project dashboard Excel will save them a lot of stress by enabling them to manage their project from a single point.
The need to carry out the detailed estimation of a construction project has spurred the construction project teams to embrace the construction cost estimate template Excel. It prevents them from exceeding their budgetary provision thereby assisting them to make a substantial gain from their projects.
The use of the Excel project management template assists in communicating the status of your project to the relevant stakeholders.
Timeline chart in Excel
A timeline chart in Excel is useful for project managers in managing the milestone, deadlines, and other key events of a project. The examples of timeline in Excel are horizontal timeline, chronological timeline, and vertical timeline. They are always with the marked units of time and events.
As a project manager, are you finding it difficult to create a timeline chart in Excel?
Do away with your worry, in the steps below; you will learn how to create a project timeline in Excel.
How to make a timeline in Excel
- Firstly, you are required to arrange your data in columns in chronological order in your bid to make a timeline in Excel. You need the following columns of data; the unit of time, Event name, and Event height and direction.
- The next step needed to make a timeline in Excel is the selection of the cells of the time unit, Event height, and direction columns. On the Insert tab of the ribbon in the chart group, just click on the Insert Column or Bar chart Button. In the opened menu, just click on the first option which is usually the clustered column.
- Click on the chart Element button. In the chart Element Menu, click on the arrows to the right side of the labeled Data options. Then, in the displayed sub-menu, choose More options.
- This unravels the format Data labels task section: Here, you are required to undo the value option and click the value from cells option
- On the opened Data Label Range box, choose the cells of the “Event Name” column and click OK on it.
- Click on the data series column to choose, then on the Format Tab under chart tools, select No Fill in the Shape Fill drop-down menu
- Click on the Chart Elements button once more. In the Chart Elements menu, click on the arrow to the right of the Error Bars option, then choose More Option.
- On the Format Error Bars task section, choose Minus for direction, No cap for End Style, and Percentage for Error amount. You can put the Percentage at 100%
- Then another step required to make a timeline in Excel is the removal of the vertical axis and the grid lines from the chart.
- Click on the horizontal axis to select it and on the Format Tab beneath the chart tools; you can make some changes to the color.
- Then click on the error bars to choose them and select the preferred color in the shape outline drop-down menu.
- The final step to make a timeline in Excel is typing the title of the chart in the Chart Title box.
With the steps above, you can insert a timeline in Excel.
On the flip side, Excel does not give a detailed insight into project management because it does not come with a built-in timeline chart. Also, it is not effective for managing multiple projects at the same time because it cannot track different tasks in multiple projects efficiently.
Look no further, tools like Sinnaps offers you an ideal solution for effective project management; it comes with different in-built charts that you can leverage to create the timeline chart of your project to ensure smooth management.
It has an easy-to-use interface and can be used to monitor multiple projects conveniently by providing you with real-time updates about your projects. Also, it will allow you and your team to gain clear visibility into your project.
Also, it is a planning tool that enhances teamwork and effective communication among the project team.
Steps to make a timeline chart in Sinnaps: with the following steps you can easily create a timeline chart in Sinnaps
- Open the left panel and click on the three-dot menu next to the name of the project that you want to turn into a timeline chart.
- Click on the Create template option. Then choose a new name for the timeline chart.
- After you decide on the name of the timeline chart, you can open the template editor to fill the name of your timeline chart. The template has no dates in the calendar so it can be used in any date.
- You are free to edit the template, add activities, resources, docs, links, images, or activity descriptions to the ones you desire to have in the project.
- Activities that depend on fixed dates will be considered to have no dependencies and because of this reason, they will be placed at the beginning of the project.

Making a timeline chart in Excel vs. Sinnaps
In comparing how to make a timeline chart in Excel vs. Sinnaps; making a timeline chart in Sinnaps is much easier as it already has different templates that you can customize to meet the needs of your project.
Also, creating a timeline chart in Sinnaps allows deducing the slack of your activities. However, you cannot do the same with Excel.
Again, creating a timeline chart in Sinnaps allows you to plan using dependencies and it automatically calculates your critical path by taking into consideration the duration of activities, time constraints, and dependencies but you cannot do this with Excel.
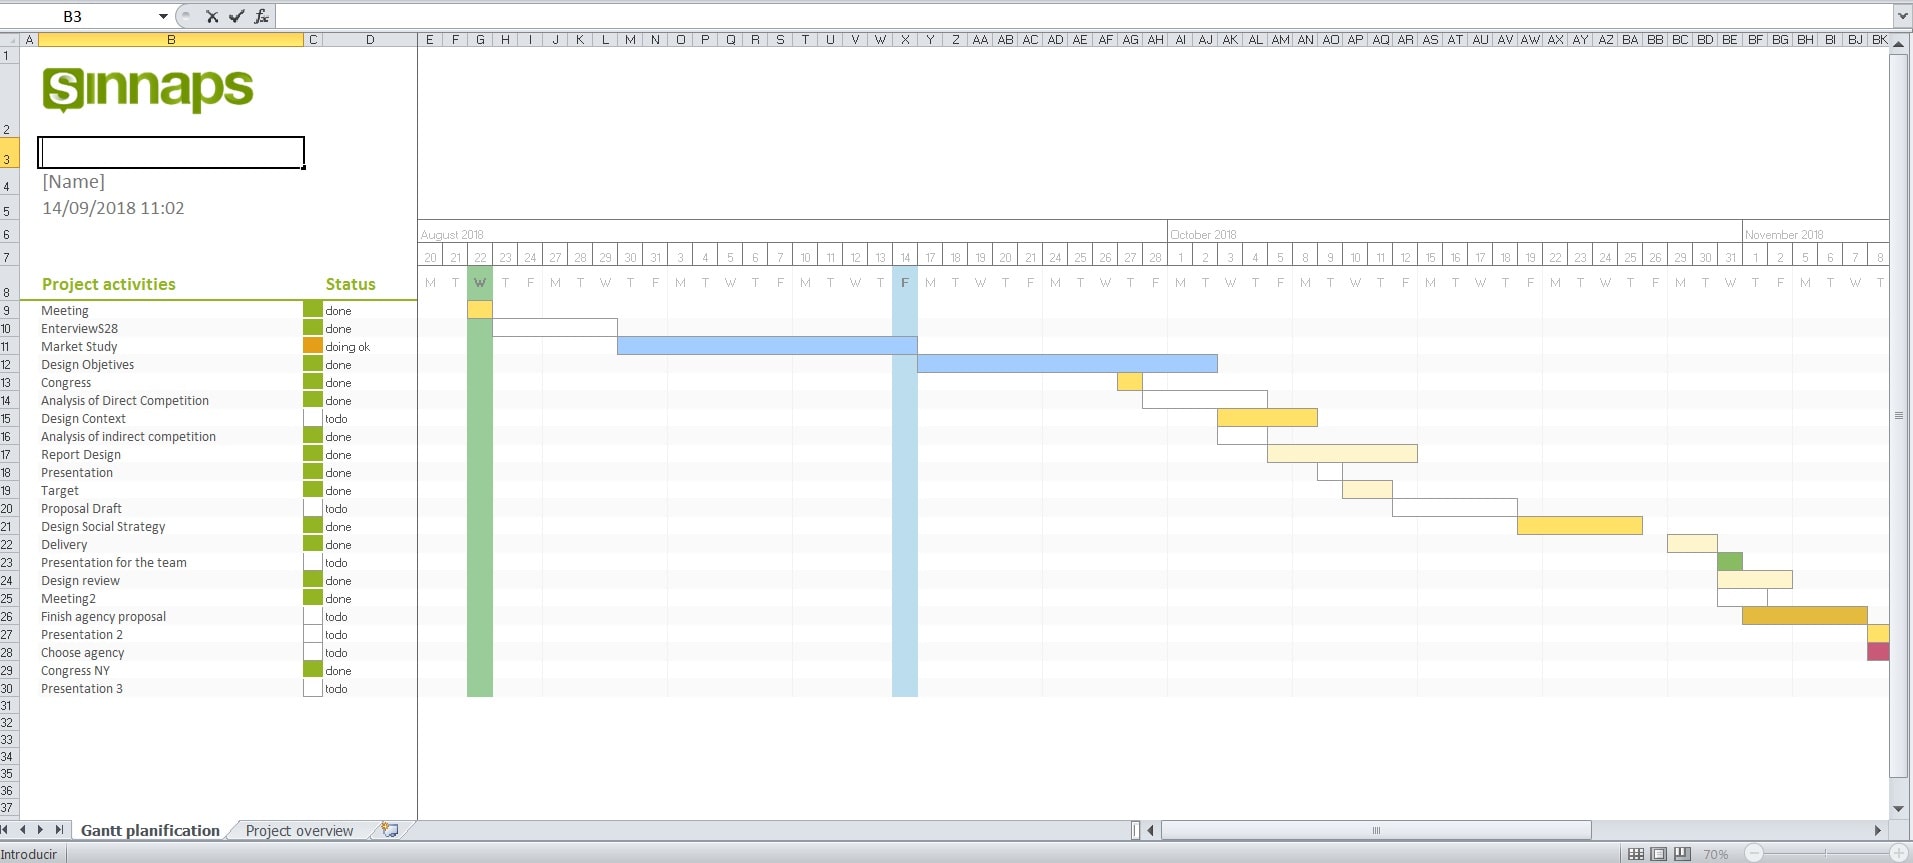
Sinnaps is embedded with other tools unlike Excel such as the Gantt chart which you can download. Gantt chart aids you in gaining a clear overview of your project activities by showing the task relationships. The use of an Excel Gantt chart timeline enables the project team to identify the critical paths which help you in making rapid adjustments to your project.
A Gantt timeline Excel will showcase the dependencies among the tasks of the project. On a Gantt chart Excel, the project team can deduce the status of a project and see the completed percentage of the tasks. Gantt chart Excel template is a tool that can be easily downloaded for the use of the project team in gaining insight into their project management.

