Sinnaps enables resources to be viewed in a unique way which eases planning, bearing in mind the real consumption of resources in each activity. With the resource viewer, we can easily check the behaviour of any resource we have access to in each project.
What’s more, we have the chance to overlay various graphics for the same or other resources. With this, we can compare information and change the planning at the same time to see its impact on the project. This way we get planning that is more in line with the available resources.
This feature enables us to know for instance when we should delegate work or if a resource is planned with excessive consumption on a particular day. The first of these questions refers to the people assigned to the activities. Our team needs a limit to their daily effort or consumption. For this reason: when should we know that we need to share work out better, delegate tasks to other workers or, simply, delay the date of this task? The Sinnaps viewer will help us take decisions and be more effective with our changes.
So, thanks to the consumption graphic on your app, you can:
- Make effective changes in your planning.
- Check the impact of the changes.
- Compare the consumption of several resources at the same time.
- Find out the availability of one of your workers so they can work on another project.
- Share the tasks among team members in a more balanced way.
- Make progress to prevent missing deadlines as the planning will be more realistic.
- Have an overview of resource usage to better assess the cost.
- Control of all the resources your project will need to be completed.
Índice
How do I use the Sinnaps consumption graph?
Note: Before using this graph, you need to know that Sinnaps will only show the data which each user is entitled to view. Should you not have access to all the necessary data, check user authorisation.
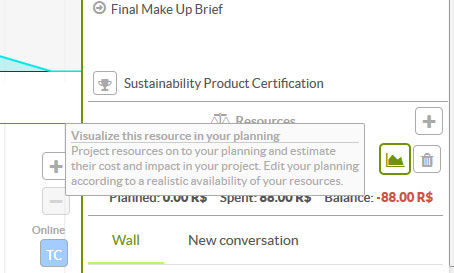
Activate the graphics that will tell us about project resource consumption by accessing through the panel for the activity in which the resources is being used. We click on the icon that we can see on the lower image.
Then, a resource consumption graph will come out directly onto our planning. By selecting a resource in the search engine, it will appear below the activity for which it is planned or for which it has already been used.
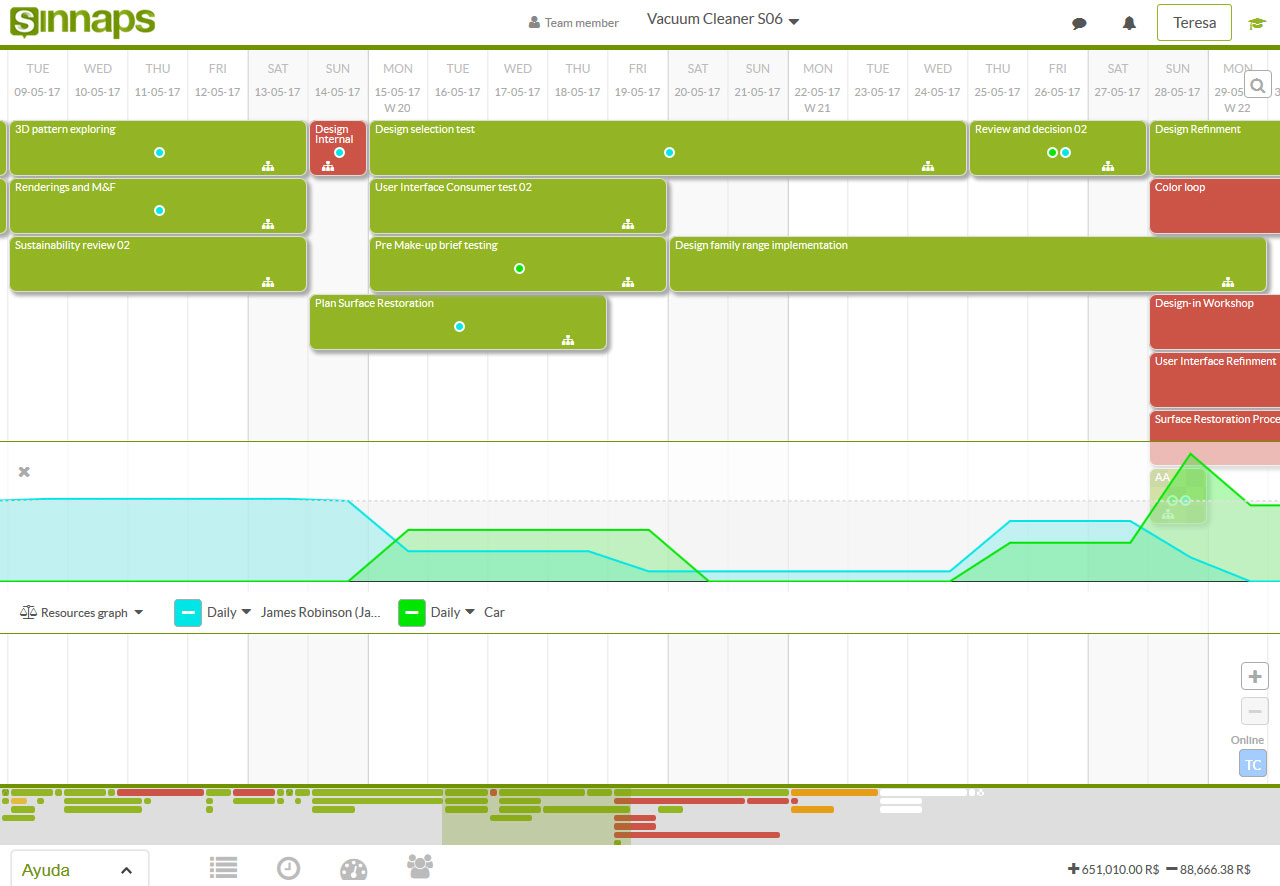
In the example in the upper image, we’ve activated two resources (Work and Material) so they will be represented on the graphic. There we can easily see the consumption of each resource in each activity.
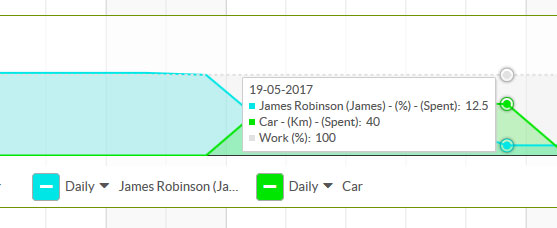
Additionally, if we click on the dots on the graph, we get the information as a percentage of the work (Sinnaps considers 8 hours to be 100%) and the units of material resources consumed.
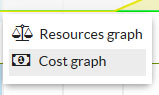
We can do the same thing when activating the costs graph, with regard to the costs arising from the resources. Click on the tab and select Cost Graph. ![]()
The graph we view with the consumption and cost selected will be as follows:
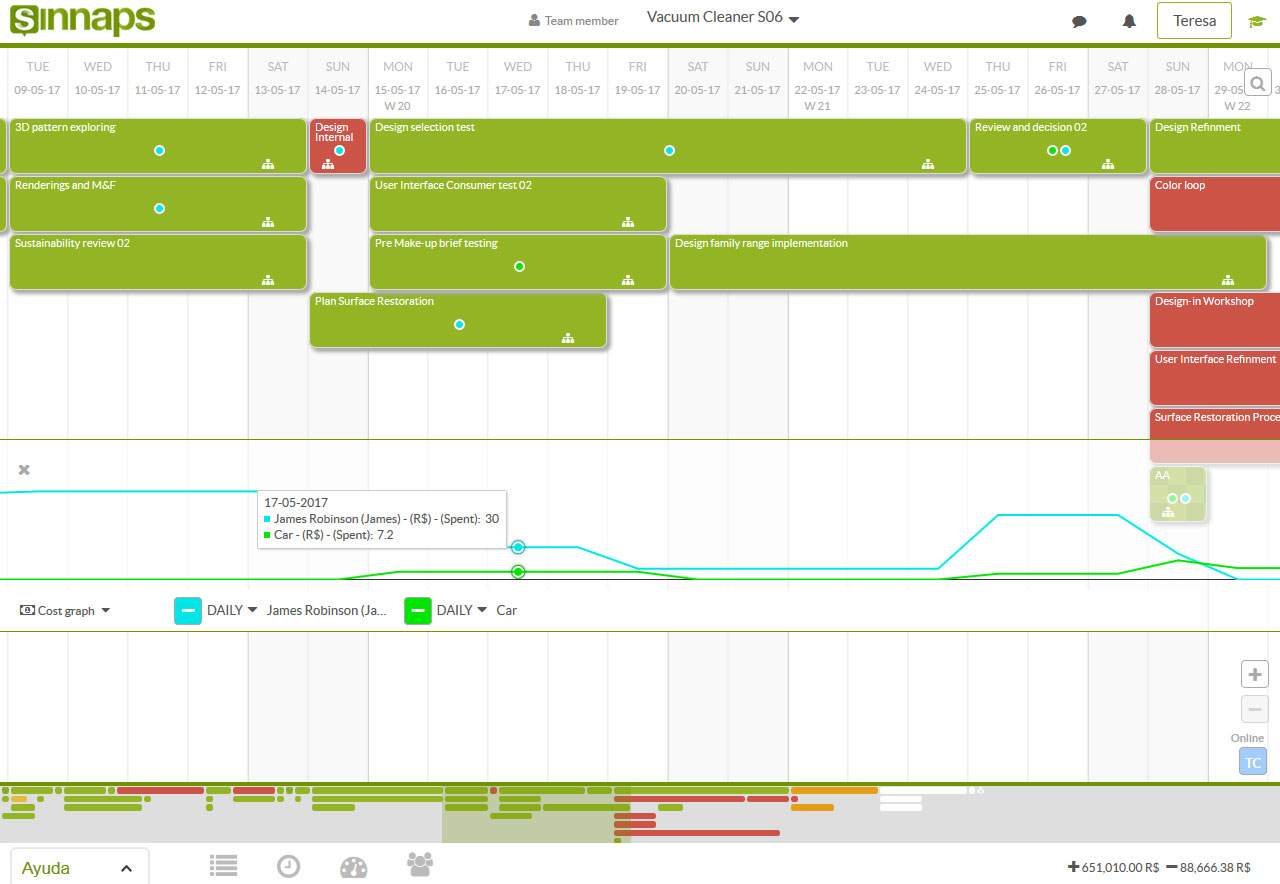
As with the consumption graph, we can see the economic cost accruing from this resource on the day chosen.
If what we want is to see the total project consumption and costs, those figures will appear in the bottom right-hand side of the planning.
![]()
Eliminate the graphic display of one of the resources by clicking on the resource exit ‘x’.

Note: it is important to point out that we are not eliminating this from the project, just from the graph. In projects involving a large number of resources, the chance to choose those we need will provide us with a visually clearer graph.
Difference between Daily, Accumulated and Global
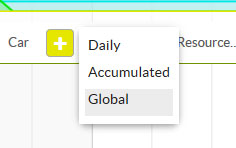
- Daily: consumption or cost from a resource over the course of a day.
- Accumulated: accrued consumption or cost from the start of the project.
- Global daily: daily consumption of a resource throughout all the projects where this resource is being used. The global daily consumption will appear to offset resource availability. In the following example, the assignment of James Robinson across all his projects is 115% for the day chosen. Knowing this beforehand, the Project Manager may offset the consumption so it does not pass 100%, moving activities James is involved in to other days or calling dibs on his availability for other projects.
Note: the ‘global daily’ parameter is particularly useful for resource planning and only shows resources assigned. Additionally, it doesn’t specify on which other projects it is being consumed for reasons of privacy.
The ‘global daily’ parameter is very good for personnel, but also for material resources as if a car is used for another project on the day you need it, this will be indicated.
Change user cost
Remember that the cost of the work by your colleagues can be changed through User Adjustment. You can add the economic value per hour of work for each team member. This way, when you assign this person to an activity, their cost is automatically added to that activity.
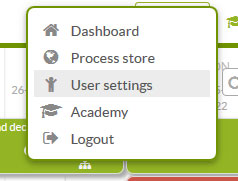
We will show you below where each user notes their economic value as a worker in User Adjustment.

Trick: if you want to give a person’s work a different economic value for a specific activity, you can create a new resource with that person’s name and give it the cost you need.
