Program Evaluation Review Technique (PERT) has its origins based in the US Navy. The technique was developed in the 1950s in order to manage the Polaris submarine missile program.
A PERT chart is used to organize, schedule and coordinate a variety of tasks. Pert project management provides a clear overview and clearly defines project dependencies and allows for slack in tasks which are set aside from the overall projects critical path.

At the same time in the private sector, a similar technique called Critical Path Management was also developed. The two are now essential to effective project management with PERT leading the way.
PERT is an acronym for Program Evaluation Review Technique. A PERT chart aids project managers in carrying out a detailed analysis of their projects to enhance their decision-making effort. Find here a PERT Chart template for thorough project analysis.
Related links…
Function of Project Management
Índice
PERT Diagram
A PERT diagram uses a PERT calculator to establish the PERT method and technique. It takes into account changes that occur throughout the project which will have an overall impact of the completion of a project.
The PERT calculator utilises four key duration estimates of optimistic, pessimistic, most likely and expected. It also allows for tasks to be defined as dependent or non-dependant tasks based on their relationship with required actions. Using these calculations, the PERT diagram achieves a PERT estimate.
How to make a PERT chart
PERT charts are a powerful tool as nodes can be colour coded to incorporate vital metadata such as resources and budget.
Using a PERT chart generator, the nodes represent a sequence of milestones and tasks so that dependencies and critical planning are factored into the complete project lifecycle. It also functions as a network chart.
Dependencies between activities

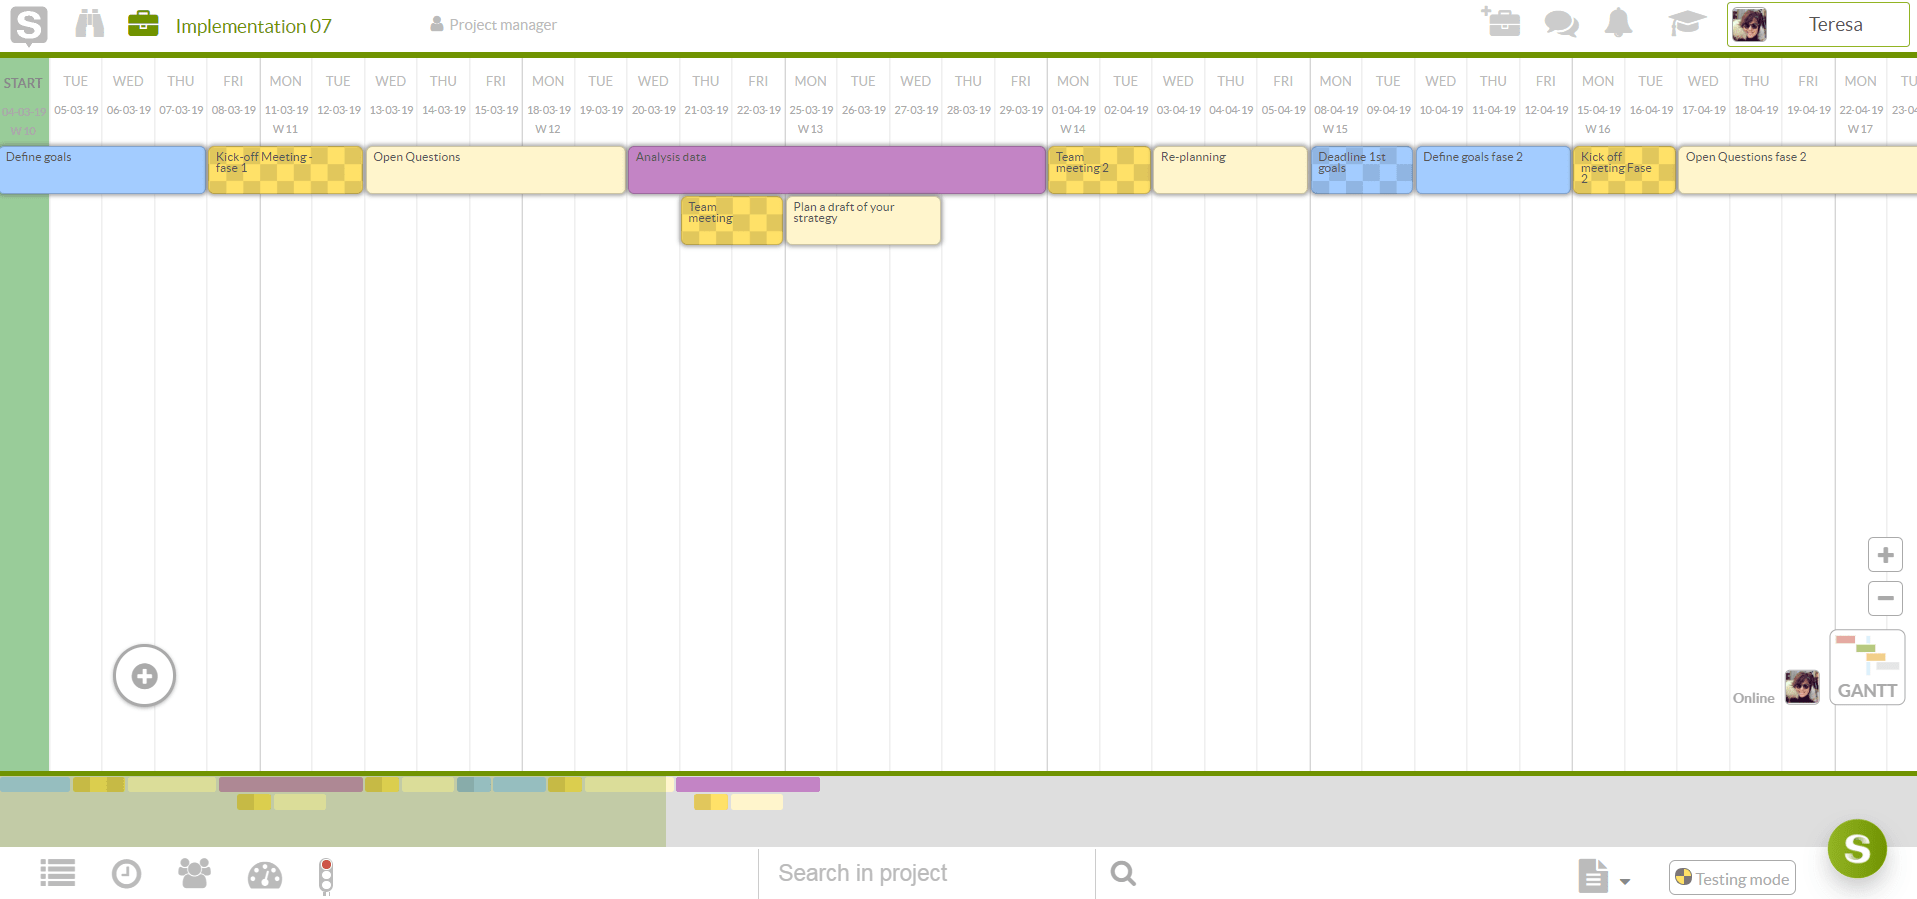
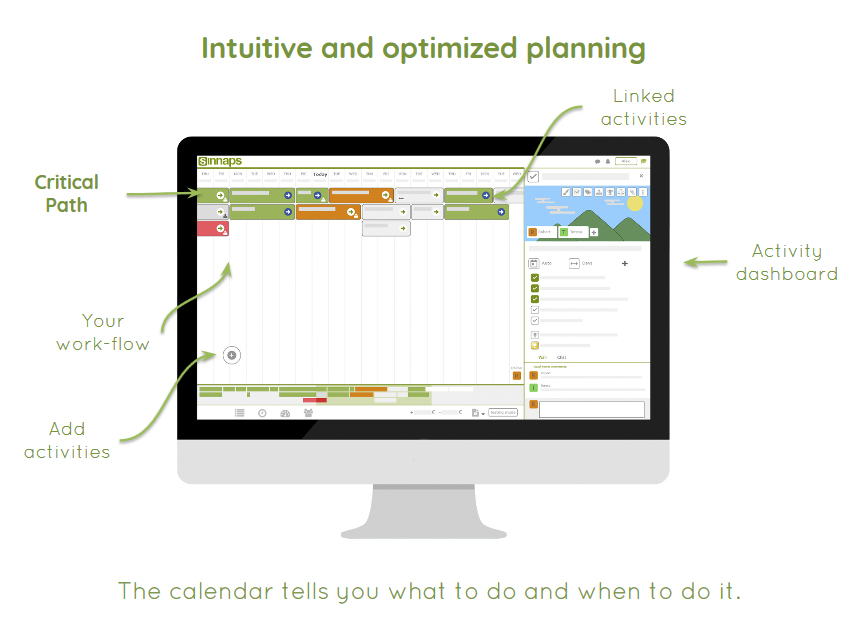
Sinnaps online project management software is the perfect tool for PERT planning and scheduling. Some project managers opt to utilise an online PERT chart excel diagram, but this can be time-consuming and consume valuable resources. PERT chart software removes these added constraints simplifying the process.
PERT Example

PERT Analysis
Using Sinnaps PERT chart software for evaluating the strategic relationships between dependant and non-dependant tasks and activities you can determine the minimum time it takes to complete each task. It measures the duration’s and provides the length of the critical path.
This difference in time is used to determine how much slack can be applied to an activity which may need to be delayed while still allowing the subsequent activities and the overall project to be completed as per schedule.
What is Activity Slack?
PERT Full Form
Pert full form looks at the actual performance of a task which consumes time and requires resources such as space, materials, system and even machinery. Pert represents the time and effort required to progress from one activity to another. The next Pert activity cannot be performed until the predecessor event has occurred defining the scope of the workflow. Bottlenecks can be seen as a visual representation making them easy to tackle head-on.
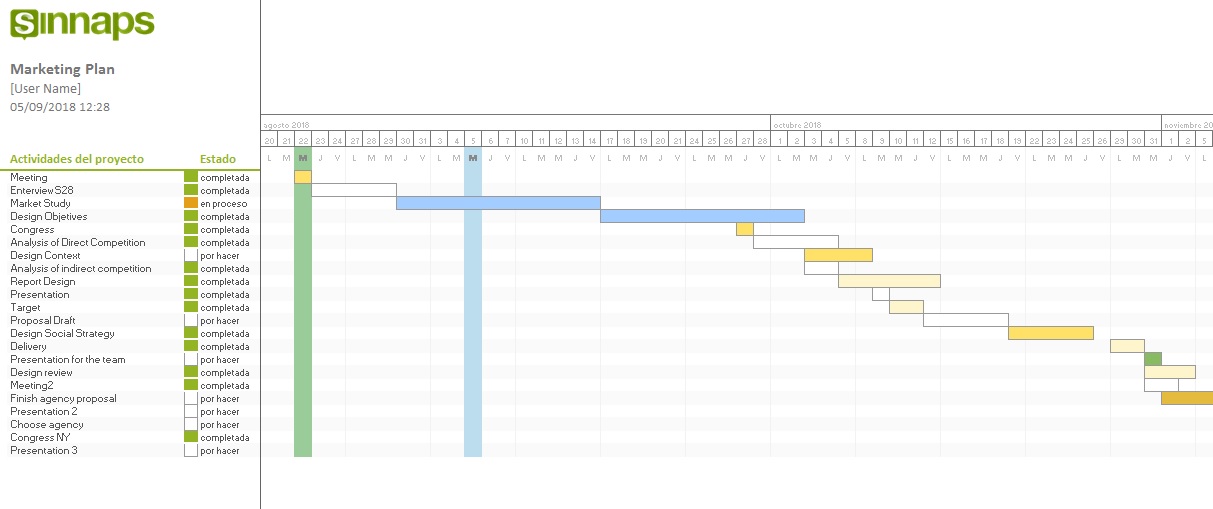
PERT example in Excel

Program Evaluation and Review Technique
The program evaluation review technique is intuitive and provides clear statistical information as a visual diagram. PERT chart software makes the most of PERT planning and scheduling to enhance a project managers ability to deliver on milestones and deadlines.
Free online Project Management course
Lesson 4: The milestones, ‘to be or not to be’ and shall we continue with the project?
You will receive 5 lessons over the course of 15 days.

Sinnaps PERT chart generator lets the software do the work so you can concentrate on the aspects of the project that need the most attention.
Related links…

